The Allocation of Talent and U.S. Economic Growth: Hsieh, Hurst, Jones and Klenow (2019), replicated and extended to 2024
In 1960, by the paper's count, 94 percent of American doctors and lawyers were white men. Hsieh, Hurst, Jones and Klenow ask how much of U.S. growth since then came from women and Black Americans moving into jobs that fit their talents, as the frictions to those jobs fell. Their model of occupational choice infers each group's frictions from Census data on who works where and what they earn. It finds that falling frictions explain 41.5 percent of the growth in market GDP per person from 1960 to 2010. Our extension adds Census data for 2022–2024 and finds that falling frictions still add about 0.06 percentage points a year to growth after 2010, faster than the 0.04 of 2000–2010, but that this is now only about 7 percent of all growth (4 to 8 percent under other data choices).
That share is at the low end of the paper's decades: close to the 1960s and 1990s, far below the 1970s and 1980s. Progress has not stopped. Frictions are still falling, at least as fast in absolute terms as in the 2000s. But they are falling slowly. For women, the data fit a slow approach to a floor that stays above parity with white men. Black men's frictions have already dipped below the floor implied by the 1960–2010 data. If frictions keep falling on this path, the model projects only a small further gain. This is a conditional projection, not a forecast.
The replication in brief
The paper's results reproduce. We re-ran the authors' data and code, and the central result came out at 41.5 percent, exactly the printed value. All twenty cells of the main table (Table V) match, and so do nearly all other tables. The appendix has the full tables and the three small differences we found.
One check on our new data failed. We rebuilt the paper's 2010 data from public Census files. Average earnings came out about 2 percent off the authors' file, beyond the 1 percent limit we set in advance. This does not change the frictions, but it does change the growth shares. A second appendix covers it in full.
Frictions kept falling after 2010, but slowly
The model measures each group's frictions against white men. Suppose a group is much rarer than white men in an occupation, and wages do not explain the gap. The model then reads the shortfall as a friction. There are two kinds:
- The skills friction keeps a group from getting the training an occupation needs before entering the labor market. Unequal access to schooling is one example.
- The labor-market wedge cuts a group's pay once they hold the job. It stands in for discrimination at work.
A friction of 1 means a group faces the same conditions as white men. Higher values mean larger frictions.
The paper's data end in 2010, so the obvious question is whether this shift continued. We added one new period to the paper's model. It combines the Census Bureau's American Community Survey (ACS) microdata for 2022, 2023 and 2024 into one sample. We label it 2023, the middle year, just as the paper's last period combines 2010–2012. Everything else is the paper's: the model, its 66 occupations, its four groups (white men, white women, Black men and Black women), and its method for inferring frictions.
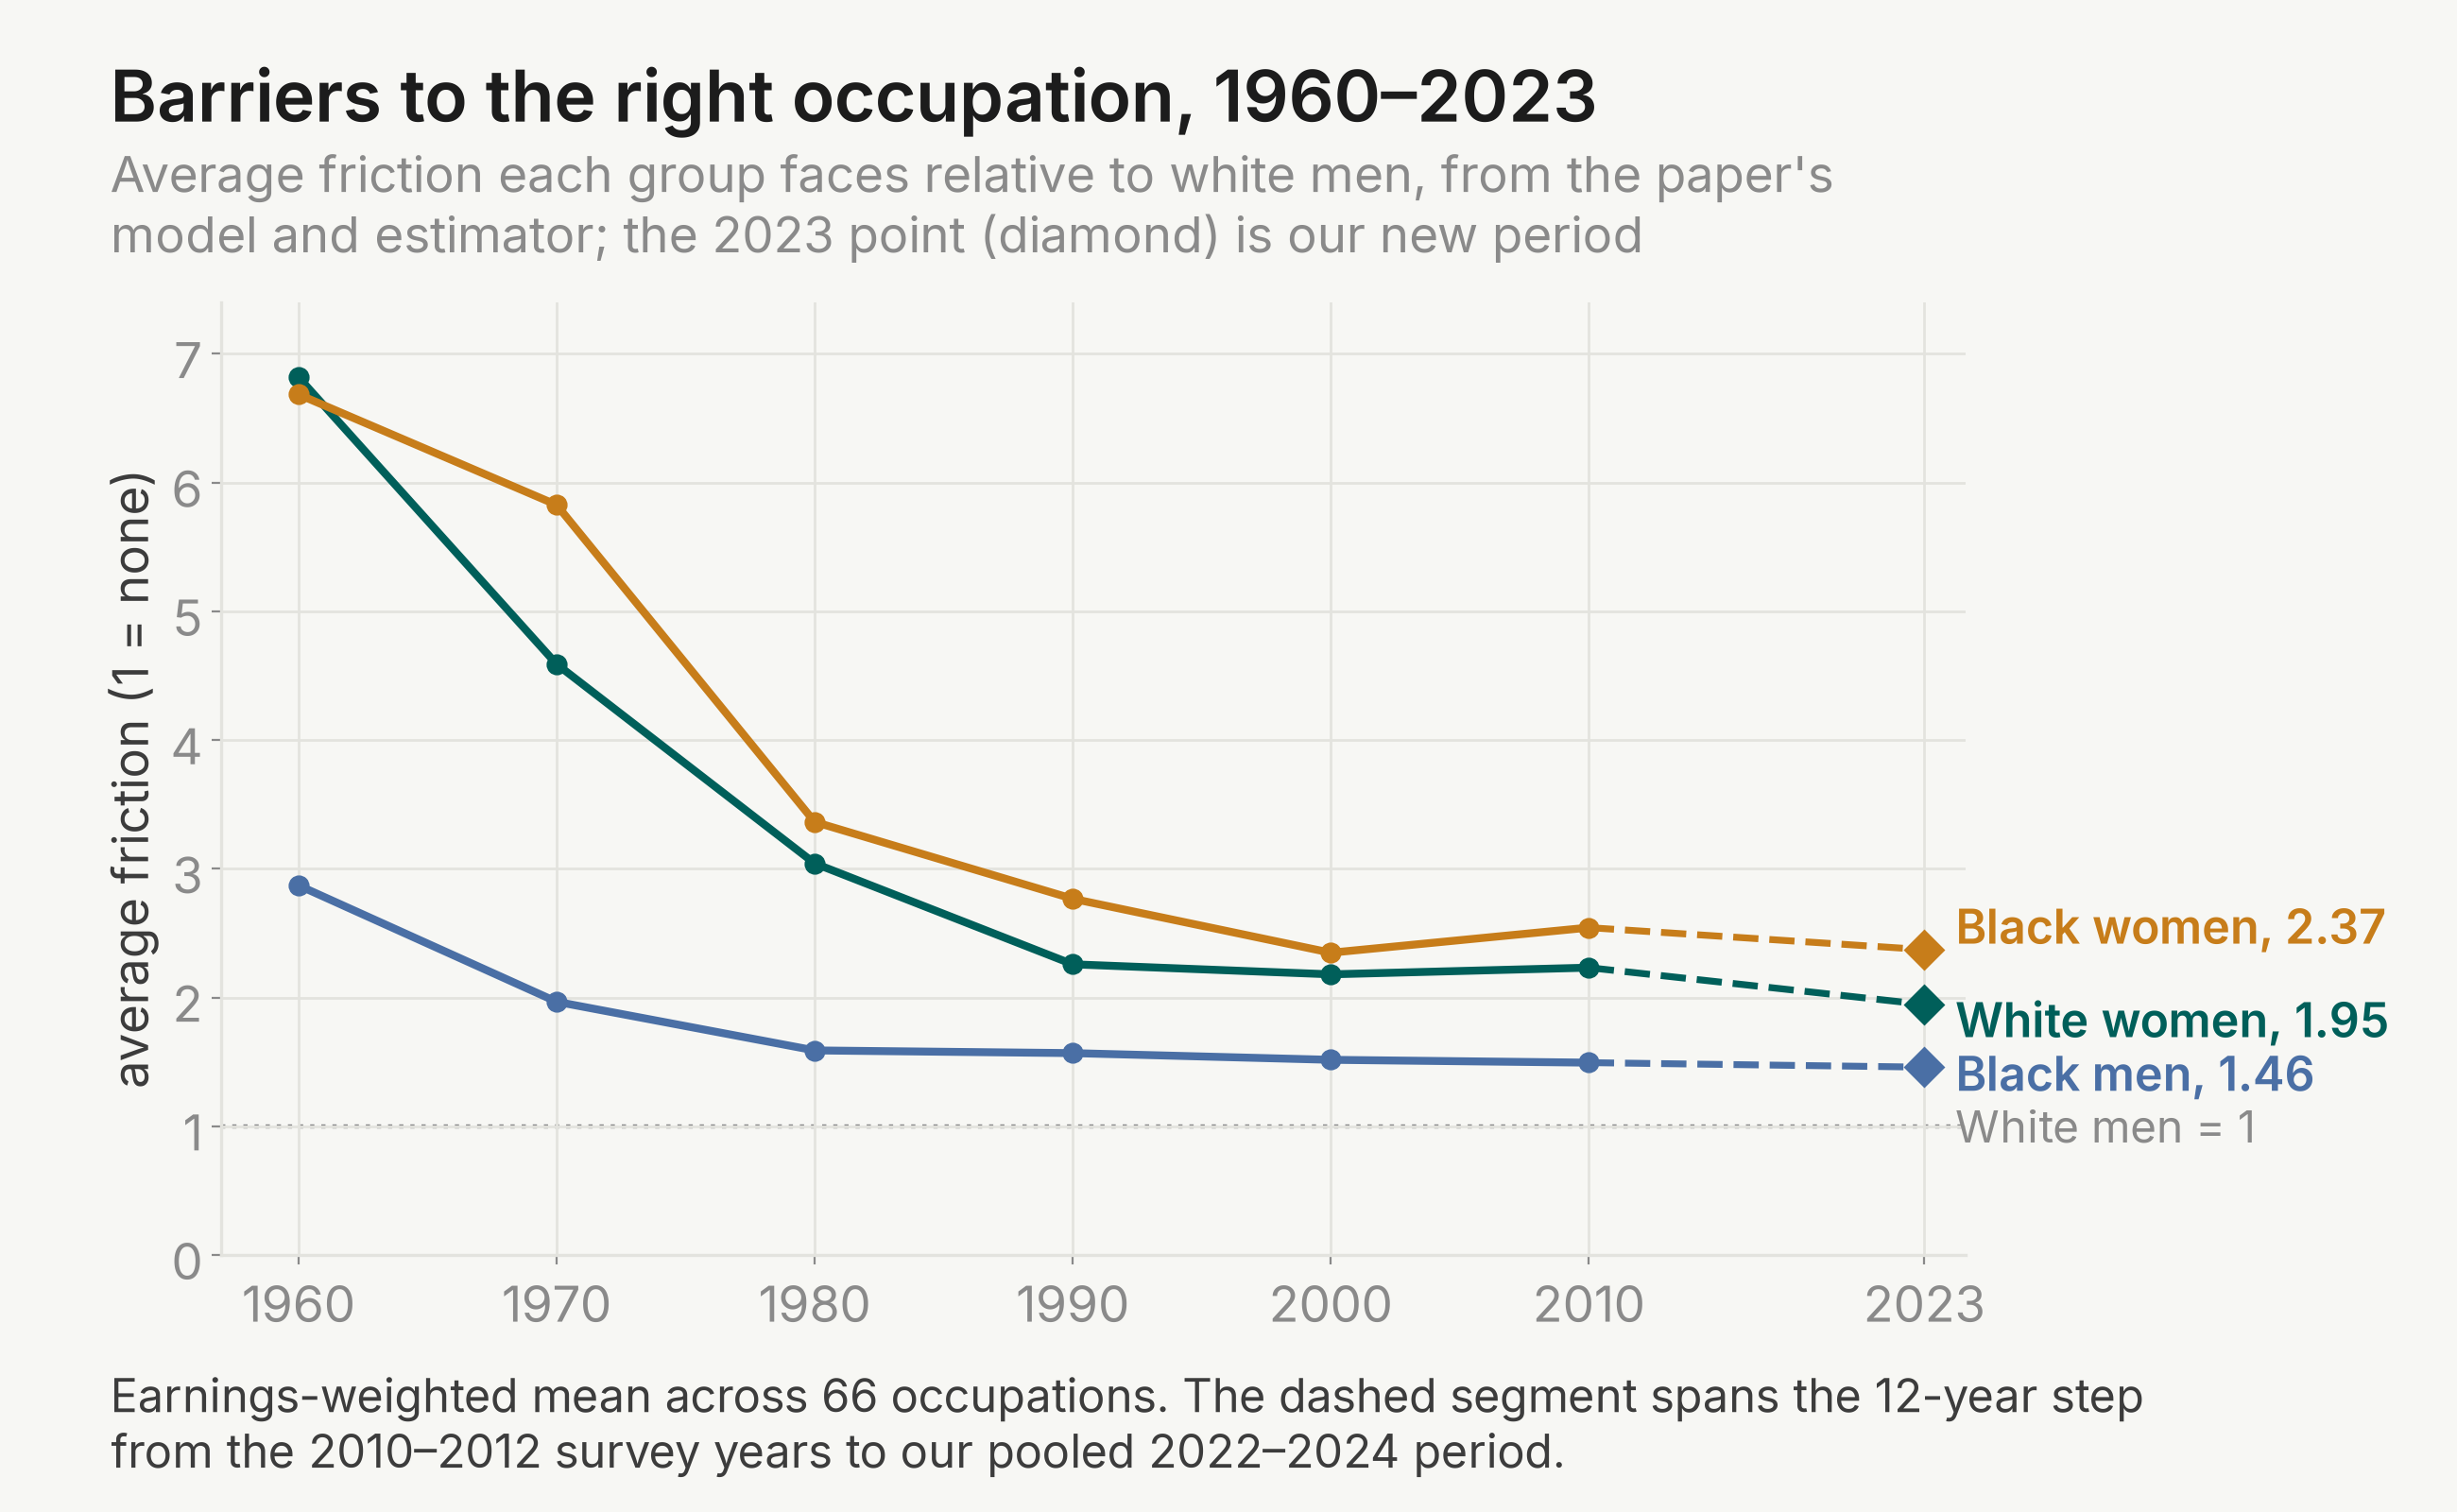
The average friction kept falling after 2010, but slowly.
| Group | 1960 | 2010 | 2023 |
|---|---|---|---|
| White women | 6.8 | 2.23 | 1.95 |
| Black women | 6.7 | 2.54 | 2.37 |
| Black men | 2.9 | 1.49 | 1.46 |
Doctors and lawyers show the same pattern up close. White women's friction fell from 7.9 for doctors and 11.6 for lawyers in 1960 to about 1.1 and 1.2 in 2010. By 2023 it was 1.01 and 1.04, essentially parity with white men. Construction is different: white women's friction there was still 6.3 in 2023. By our count from the Census data, white men's share of doctors and lawyers fell from 57.7 percent in 2010 to 51.1 percent in 2023.
These averages, plotted in Figure 1, weight each occupation by earnings. On this measure, women's frictions rose slightly over 2000–2010: from 2.18 to 2.23 for white women and from 2.35 to 2.54 for Black women. An average in logs gives less weight to the few occupations with very high frictions. On that measure, frictions fell for all three groups over the same decade. The model's output depends on the full spread of frictions across occupations, not on one average. This is how falling frictions could still add to growth in 2000–2010.
Falling frictions add as much growth as before, but a smaller share of it
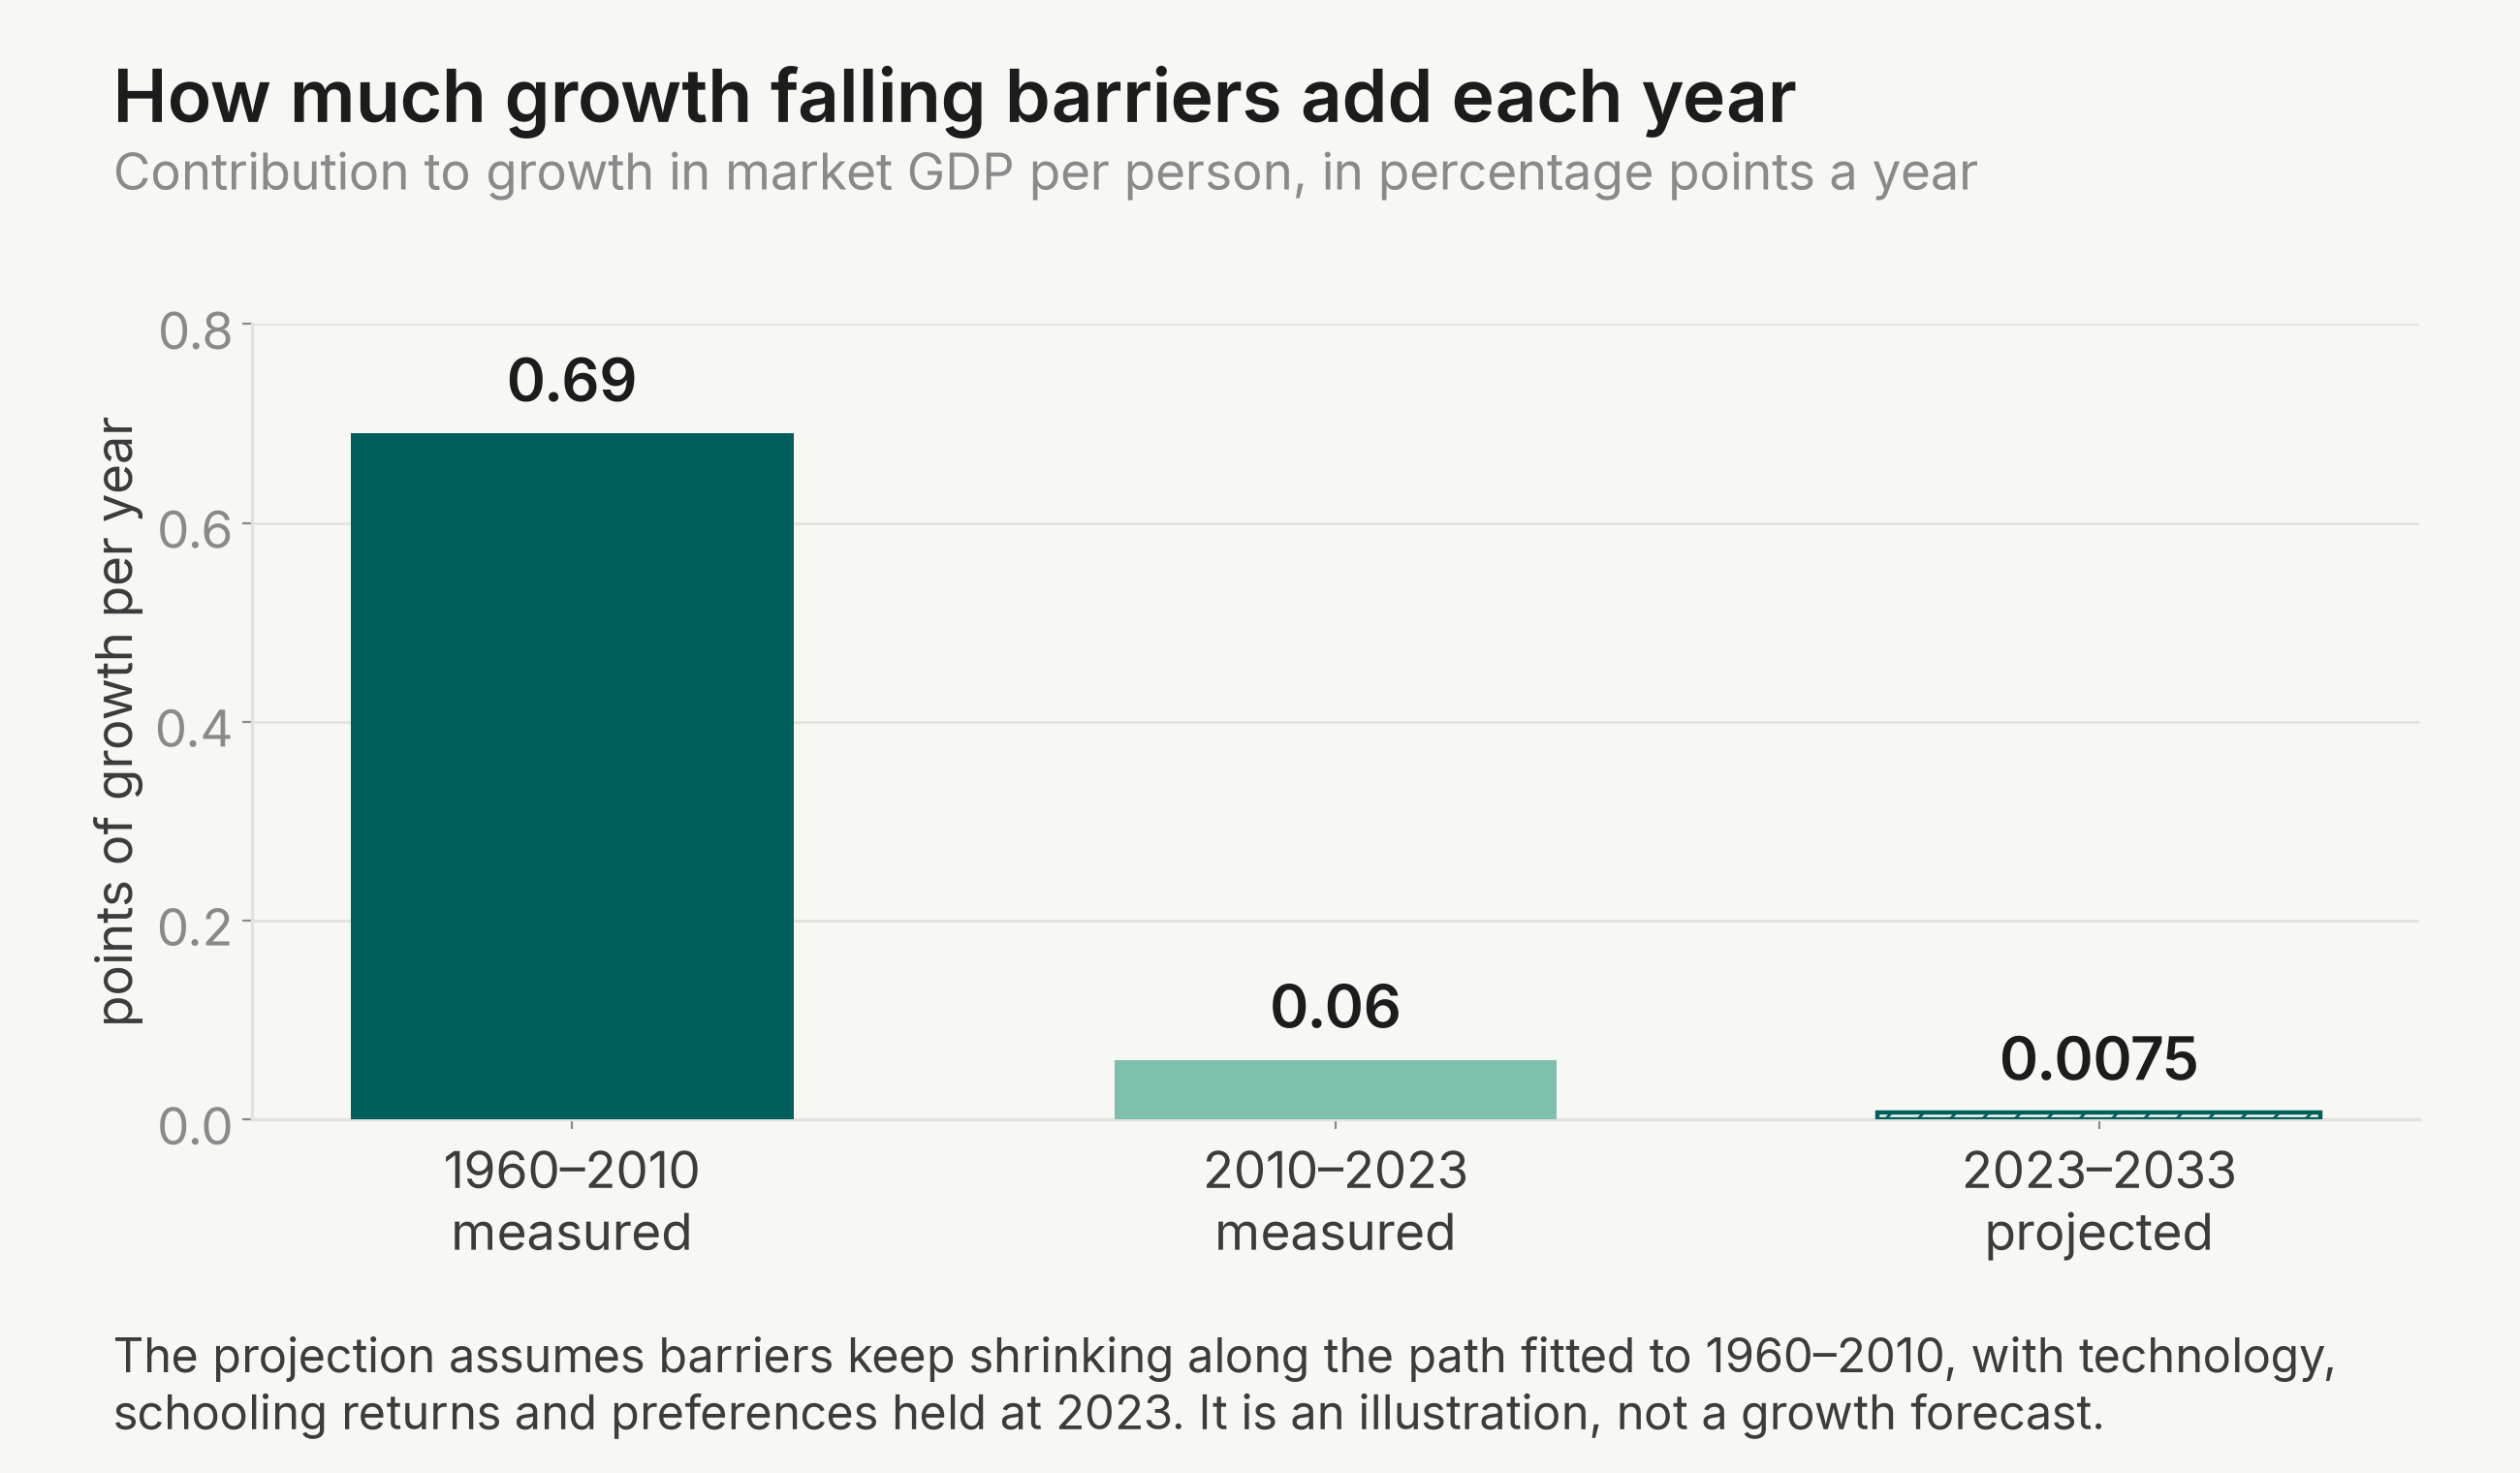
How much did falling frictions add to growth? The clearest answer is in absolute terms. They added about 0.04 percentage points a year to growth in market GDP per person over 2000–2010, and about 0.06 over 2010–2023. So the contribution did not slow. At these rounded values, it was about half again as fast.
As a share of all growth, the post-2010 contribution is small. Falling frictions explain about 7 percent of growth in 2010–2023, against 7.3 percent for 2000–2010 in the same run. Other data choices give 4 to 8 percent for 2010–2023. Compare this with 56 percent in the 1970s and 40 percent on average over the half century. The earnings-check appendix explains the range, including a possible error in the paper's price adjustment.
Contribution of falling frictions to growth in market GDP per person, 2000–2010 and 2010–2023
| 2000–2010 | 2010–2023 | |
|---|---|---|
| Contribution, percentage points a year | 0.04 | 0.06 |
| Actual growth, percent a year | 0.58 | 0.89 |
| Share of growth from falling frictions | 7.3 | 7.0 |
Notes. Both windows come from the same seven-period run of the paper's model, with the paper's price adjustment. Growth is the model's market GDP per person. The yearly contribution divides by 10 and 13 years, the gaps between periods in the model's code. The Notes give the figures using the gaps between the middle years of the surveys instead. The earnings-check appendix repeats this table under a corrected price adjustment; the contribution does not change.
The 40 percent average for 1960–2010 hides large swings across decades. Under the paper's price adjustment, the share of growth from falling frictions was:
| Period | Share of growth from falling frictions |
|---|---|
| 1960s | 6.8 |
| 1970s | 56.0 |
| 1980s | 15.4 |
| 1990s | 3.3 |
| 2000–2010 | 7.3 |
| 2010–2023 | 7.0 |
So the post-2010 share is not unusually small by every standard. It is at the low end of the range, near the 1960s and 1990s. The 1970s and 1980s carry the half-century average. Over 1960–2023 as a whole, falling frictions explain 38.5 percent. Most of the recent contribution comes from white women: 5.2 of the 7.0 percent.
The growth accounting over 1960–2010 and 1960–2023
| Paper, 1960–2010 | Our extension, 1960–2023 | |
|---|---|---|
| Share of growth in market GDP per person from falling frictions | 41.5 | 38.5 |
| from the skills friction only | 36.0 | 34.2 |
| from the labor-market wedge only | 7.7 | 6.2 |
| Output gain from removing all remaining frictions, end year | 9.9 (2010) | 9.0 (2023) |
Notes. All values use the paper's price adjustment. The 1960–2023 shares and the 9.0 percent are the same under the corrected adjustment described in the earnings-check appendix, because it affects neither 1960 nor 2023. In the same seven-period run, the 1960–2010 share comes out at 41.3, within 0.2 points of the paper's 41.5. Adding the new period barely disturbs the original result.
What remains to be gained has changed in kind. Removing every friction would have raised output by 9.9 percent in 2010, and would raise it by 9.0 percent in 2023. But the source has narrowed. In 2010, removing only the skills friction would have added 1.6 percent, and removing only the labor-market wedge 7.1 percent. In 2023 these figures are −0.3 and 8.3. So nearly all of the remaining gain comes from the labor-market wedge.
The −0.3 is not a typo. The model allows a friction below 1, which favours a group in occupations where it is over-represented. For example, white women's friction among secretaries is 0.38 in 2023. Removing the skills friction everywhere also removes these advantages. By 2023 the two effects most likely cancel, so removing the skills friction alone gains almost nothing.
The slowdown fits a slow approach to a floor, with caveats
Why did the share of growth from falling frictions shrink from over 40 percent to a few percent? One possibility is that progress stalled after 2010. Another is that the model always implied this. If frictions decline toward a lasting floor, each decade closes a smaller remaining gap.
To tell these apart, we fitted a simple convergence law to each group's frictions, using 1960–2010 only. Let be the earnings-weighted average of the log friction across occupations. The law says approaches a floor at a constant rate :
We then checked whether the 2023 points, which the fit never saw, land where the law predicts.
Because averages logs, is a geometric average of the friction. It is always lower than the plain average in Figure 1. For example, white women's 2023 friction is 1.49 on this measure and 1.95 in Figure 1.
The fitted floors are well above parity with white men. As geometric averages, they are about 1.28 for white women, 1.42 for Black men and 1.60 for Black women. The half-lives are 17, 7 and 14 years.
The convergence law, fitted on 1960–2010, against the 2023 data
| Group | Rate of approach a year | Half-life | Floor, log (geometric average) | 2023, observed | 2023, law's forecast | Error band |
|---|---|---|---|---|---|---|
| White women | 0.040 | 17.2 years | 0.250 (1.28) | 0.397 (1.49) | 0.352 (1.42) | 0.193 |
| Black men | 0.098 | 7.1 years | 0.350 (1.42) | 0.332 (1.39) | 0.351 (1.42) | 0.046 |
| Black women | 0.050 | 13.9 years | 0.469 (1.60) | 0.566 (1.76) | 0.524 (1.69) | 0.125 |
Notes. Floor, observed and forecast values are the earnings-weighted average of the log friction across occupations, with the matching geometric average in brackets. Figure 1 uses the same weights but plots the plain average, which is larger. The fit dates the 2010–2012 period at 2011. The error band is the larger of two values, both in logs: the law's error in predicting 2010 from 1960–2000, and the spread of the 2023 value across our robustness variants. The Notes explain how it was set.
The results differ by group, and none is a clean fit. For white and Black women, the 2023 points sit a little above the forecast, so their frictions fell somewhat more slowly than predicted. But the error bands are so wide that landing inside them says little. For Black men, the 2023 point lands below the forecast and even below the fitted floor (1.39 against 1.42). Their frictions kept falling past where the law said they would stop. This casts doubt on whether 1.42 is a floor at all.
The pace of decline tells the same story. We measure pace as the yearly fall in the log average. After 2010, compared with their 1960–2010 average pace, frictions fell at:
- about a third of the pace for white women (0.34);
- about a fifth for Black women (0.20);
- about an eighth for Black men (0.13).
So the slowdown is real for all three groups. For women, it fits a slow approach to a floor well above parity, though the laws are too loose to rule much out. For Black men, the floor is not well pinned down.
None of this says what the remaining gap is. The model reads a change in what particular tasks pay as a change in frictions. So a floor could reflect such a change rather than a lasting friction.
Which kind of friction fell after 2010 depends on the group. For Black men and Black women, almost all of the decline came from the skills friction. The labor-market wedge rose slightly for Black men and was a small part (12 percent) for Black women. For white women, the labor-market wedge accounts for about half of the decline, 47 percent (see Notes).
What the law projects for the next decade
What does the law imply for the future? Suppose frictions keep shrinking along it, with technology, the returns to schooling, preferences and population shares held at their 2023 values. Solving the model again with the smaller frictions raises market GDP per person by about 0.08 percent over the next decade. The gain is 0.13 percent over two decades, and 0.23 percent if frictions reach their floors.
The law describes the combined friction, not its two kinds, so the projection must apply the further decline through one of them. We apply it through the labor-market wedge in 2023 only. The reason is technical. In the model, each cohort's skills friction is set when the cohort is young and stays with it through its working life. Changing it for one period would mean re-solving every cohort's path. This is an awkward assumption, because most of the recent decline for Black men and women came from the skills friction. We did not run the projection through the skills friction.
The projected gain is about 0.0075 percentage points a year. That is about a ninetieth of the 0.69 a year in 1960–2010, and about an eighth of the 0.06 in 2010–2023. The projection assumes the law holds and everything else stays fixed. It is not a growth forecast. It is also within the law's own error. For white women, the forecast error (0.193 in logs) is about four times the decline the law projects for the next decade (0.049). So the number tells us more about the shape of the law than about the future.
The narrow reading is that the paper's own caution holds up. The authors wrote that most of the productivity gains from occupational convergence came between 1970 and 2000. They saw this as a reason to expect less growth from it after 2010. Thirteen more years of data bear that out. Frictions are still falling, at least as fast in absolute terms as in the 2000s. But in the model, the remaining gap closes slowly, if at all. The model cannot tell whether that gap reflects frictions, preferences or differences in talent.
How this relates to later research
Hurst, Rubinstein and Shimizu (2024, American Economic Review) find that the adjusted wage gap between Black and white men has stayed roughly flat since 1980. Taste-based discrimination fell, but rising returns to abstract tasks offset it. We find that the model's labor-market wedge for Black men has been flat or slightly rising since 2010, and the remaining decline is on the skills side. This fits a world where less discrimination does not show up one for one in what the model measures. Our extension does not test their task-based mechanism. The model would absorb a change in task returns as a change in frictions.
Notes
These are the judgment calls and data limits behind our numbers, so you can decide how much weight each result deserves.
- The model is calibrated, not estimated, so no number on this page has a standard error. The appendix explains the calibration.
- Figure 1 averages frictions across occupations the way the paper's code does. On that average, Black women's 1960 friction is 6.69.
- Frictions are what remains after wages are accounted for. This assumes that talent differences between groups never change. If preferences or the returns to particular tasks shifted after 2010, part of what we call a change in frictions is something else. The same applies to the fitted floors. The model cannot say whether they reflect lasting frictions, preferences or differences in talent.
- The yearly contributions divide by the gaps between periods in the model's code: 10 years for 2000–2010 and 13 for 2010–2023. Using the middle years of the surveys instead gives gaps of 11 and 12 years. The contributions then become about 0.036 and 0.065. This strengthens the finding that the contribution did not slow.
- In 2020 the ACS changed how it asks about race, and many Hispanic respondents moved out of "white alone". Our main definition counts as white anyone who reports white and not Black, regardless of Hispanic origin. This keeps the paper's concept. The 2010–2023 share is 7.0 percent under our main definition, 4.4 percent counting only non-Hispanic whites, and 5.2 percent using the literal "white alone" code. (The 5.2 matches the figure under the corrected price adjustment by coincidence.) The 1960–2023 share moves by 0.2 points.
- Today's occupation codes reach the paper's 66 occupations through public Census and IPUMS crosswalks, tables that translate one coding scheme into another. 96.5 percent of 2022–2024 employment is in codes that map to a single occupation, and none is left unmapped. The other 3.5 percent is in 19 of the 538 codes. Our alternative mapping changes only 5 of those codes. So it is a narrow check, not a full measure of mapping uncertainty.
- Since 2019 the ACS records weeks worked as an exact number. The 2010–2012 files only have ranges. We checked that this does not change who counts as a full-year worker. The share of workers with 48 to 52 weeks moved by 0.95 points between 2018 (ranges) and 2019 (exact weeks), within our 1-point limit.
- The authors' code is fixed at six periods, 1960 to 2010. We extended it to seven. We also added a what-if calculation that freezes frictions at any chosen year; the authors' version could only freeze them at 1960. In it, people already working in that year keep the frictions estimated for them. The extended code reproduces every original result exactly. We confirmed in the running code that the what-if follows this rule. The 1960–2010 results in the seven-period run move by at most 0.2 points.
- The model follows each birth cohort as it moves from one ten-year age band to the next. Our last step is 12 years, but the age bands are 10 years wide, so the new period's bands do not track the same cohorts exactly. Bands drawn to follow the cohorts give a 2010–2023 share of 7.8 percent. Our data variants include 2024 alone, the alternative occupation mapping and the race codings above. Across all of them, the 2010–2023 share ranges from 4.4 to 7.8 percent, and the 1960–2023 share from 37.2 to 38.7. Adding the earnings check widens the 2010–2023 range up to 8.4.
- 2022–2024 were tight post-pandemic labor markets. The 2025 ACS was not yet released when we ran the study on October 5, 2026, so 2022–2024 is the newest period available.
- How well does the model fit the new period? In 2023 its earnings per worker are 4.9 percent below the data (60,918 against 64,080 in 2023 dollars). Its participation rate matches closely (0.790 against 0.792).
- To judge each convergence law, we also fitted it on 1960–2000 only and checked how well it predicted 2010. Before seeing any 2023 results, we fixed the rule for each group's error band. The band is the larger of that back-test error and the spread of the 2023 value across our data variants. The back-test error uses data through 2010 only, so it was known in advance. The spread could only be measured after we built the 2023 data. White and Black women's 2023 points sit above the forecast by 0.046 and 0.042 in logs. Both are well inside bands made wide by loose back-tests (errors of 0.19 and 0.13).
- Black men's law back-tested tightly, with an error of 0.010 in logs. Yet their 2023 point lands 0.019 below the forecast, about twice that error. It also lands below the fitted floor (0.332 against 0.350 in logs). The miss is inside the band. But Black men's band width comes from the spread across data variants (0.046), which was measured from the 2023 data, not fixed in advance. Against the back-test error alone, the miss would fall outside the band.
- How white women's decline splits between the two kinds of friction depends on how we treat our longer final step. The model separates the two kinds partly by how a cohort's wage gap changes as it ages, so it uses wage growth over each step. The code assumes ten-year steps, and our last step is twelve years. We therefore scale wage growth over that step to ten years. Without scaling, the labor-market wedge's part is 51 percent rather than 47.
- The projection keeps the pattern of frictions across occupations fixed at 2023 and shifts only their average.
Appendix: replication details
What we were able to do
We used the authors' data and code. This includes the cohort-level analysis file chad_output_file_2019_01_24.csv, which the whole model reads. It also includes the person-level Census and ACS extracts behind it (1960_extract_composite_main.dta to 2012_extract_composite_main.dta) and the authors' Matlab model files.
We ran the authors' Matlab code under Octave 6.4, using the compatibility layer that ships with the code. We changed no calculation. We compared every table with the paper's printed values and the authors' own logs. We also read the code line by line to check that the growth decomposition matches the paper's definition. In one robustness case, the code stops at a leftover pause for manual input. We confirmed the solution was valid and let it continue; the numbers are unaffected.
For the extension, we built one new period from the 2022, 2023 and 2024 ACS microdata. We mapped today's occupation codes onto the paper's 66 occupations. We extended the model's code from six periods to seven and checked that it reproduces every original result exactly. Before using the new period, we rebuilt the paper's 2010 data from the same public files with the same code, and compared it with the authors' file. The second appendix reports the result.
The paper's main claims
- Falling frictions account for 41.5 percent of the 1960–2010 growth in market GDP per person. Market GDP is the model's output from paid work, not counting work at home.
- The skills friction accounts for 36.0 percent, and the labor-market wedge for 7.7 percent. The two kinds of friction interact, so the parts do not add up to the total.
- Falling frictions account for 90.4 percent of the rise in labor force participation.
- They account for about a third (32.7 percent) of growth in total output, counting work at home.
- White women's gains alone account for 33.8 of the 41.5 percent.
- Removing every friction that remained in 2010 would have raised output by a further 9.9 percent.
The model is calibrated, not estimated from a sample. Its parameters are set so that it reproduces each group's occupational shares and relative wages in the Census data exactly. Aggregate earnings and labor force participation are not targeted, so they serve as a check on the fit (Table IV below). For this reason the paper reports no standard errors.
What we got when we re-ran it
The paper's central result reproduces to the printed decimal. In our re-run, falling frictions account for 41.5 percent of the growth in market GDP per person. The skills friction accounts for 36.0 percent and the labor-market wedge for 7.7 percent. All twenty cells of Table V match. The following also match:
- the group split in Table VII;
- the model's fit to aggregate earnings and participation in Table IV;
- the 9.9 percent gain still available in 2010;
- the robustness tables that vary the model's parameters (Tables VIII, X and XI);
- the estimate that about 22 percent of workers choose occupations by preference rather than ability (our run gives 0.216).
Three things differ.
- One cell of Table VI comes out at 83.6 percent against the printed 86.3. It is white women's earnings growth explained by frictions and preferences together. The other 23 cells match, so a misprint is possible, but nothing in the authors' files settles it.
- The paper estimates at between 1.24 and 1.42, but the authors' files have no code for this, so we could not re-run it. Here governs how spread out talent is within each group, and how much spending on skills raises them. The model code, and everything on this page including the extension, uses the paper's benchmark values, and .
- The opening fact about doctors and lawyers has no script either. Our count from the Census data gives 94.5 percent white men in 1960, matching the paper. For 2010 we get 57.7 percent against the paper's 62. The likely reason is a different choice of which ages to count.
In the tables below, the paper's value comes first and ours second, in italics.
Table V. Share of growth due to changing frictions, all ages (published / this replication)
| Skills friction and labor-market wedge | Both kinds of friction, plus changing preferences | Skills friction only | Labor-market wedge only | |
|---|---|---|---|---|
| Market GDP per person | 41.5 / 41.5 | 40.8 / 40.8 | 36.0 / 36.0 | 7.7 / 7.7 |
| Market earnings per person | 38.4 / 38.4 | 37.5 / 37.5 | 18.9 / 18.9 | 26.0 / 26.0 |
| Labor force participation | 90.4 / 90.4 | 112.7 / 112.7 | 24.9 / 24.9 | 56.2 / 56.2 |
| Market GDP per worker | 24.0 / 24.0 | 15.0 / 15.0 | 40.0 / 40.0 | −9.8 / −9.8 |
| Home plus market GDP per person | 32.7 / 32.7 | 32.1 / 32.1 | 30.6 / 30.6 | 4.4 / 4.4 |
Notes. Each cell is the percent of 1960–2010 growth in the model due to the frictions named in the column. The second column also lets each group's taste for different occupations change over time, as the paper allows. A share above 100 means that change alone would have produced more than the whole rise, with other forces pulling the other way. A negative share means it pushed the measure down. For example, a falling labor-market wedge explains 56.2 percent of the rise in participation but −9.8 percent of growth in GDP per worker. It drew many more people into work, which raised output per person more than output per worker. Published value first, our re-run second. Every cell agrees at the printed precision.
Table VII. Share of growth in market GDP per person due to different groups, 1960–2010 (published / this replication)
| Skills friction and labor-market wedge | Skills friction only | Labor-market wedge only | |
|---|---|---|---|
| All groups | 41.5 / 41.5 | 36.0 / 36.0 | 7.7 / 7.7 |
| White women | 33.8 / 33.8 | 29.8 / 29.8 | 6.1 / 6.1 |
| Black men | 1.2 / 1.2 | 0.7 / 0.7 | 0.6 / 0.6 |
| Black women | 3.7 / 3.7 | 3.2 / 3.2 | 0.9 / 0.9 |
Notes. Each row removes the change in frictions for one group only. The two kinds of friction interact, so neither the group rows nor the single-friction columns need to add up to the total.
Table IV. How closely the model matches the data: earnings per worker and labor force participation (published / this replication)
| Year | Earnings, data | Earnings, model | Participation, data | Participation, model |
|---|---|---|---|---|
| 1960 | 18,383 / 18,383 | 18,615 / 18,615 | 0.599 / 0.599 | 0.599 / 0.599 |
| 1970 | 24,645 / 24,645 | 25,000 / 25,000 | 0.636 / 0.636 | 0.614 / 0.614 |
| 1980 | 27,088 / 27,088 | 27,900 / 27,900 | 0.702 / 0.702 | 0.653 / 0.653 |
| 1990 | 33,953 / 33,953 | 34,265 / 34,265 | 0.764 / 0.764 | 0.720 / 0.720 |
| 2000 | 39,419 / 39,419 | 41,134 / 41,133 | 0.747 / 0.747 | 0.743 / 0.743 |
| 2010 | 41,541 / 41,541 | 42,717 / 42,717 | 0.759 / 0.759 | 0.748 / 0.748 |
Notes. Average market earnings per worker in 2009 dollars, as observed in the Census data and as the model predicts them. These are not calibration targets, which is why model and data differ. The one difference from the paper is the 2000 model earnings: 41,133 in our run against the printed 41,134, a rounding difference in the last digit.
Appendix: the 2010 earnings check
The new period uses data we rebuilt from public Census files. To test whether our method matches the authors', we rebuilt the paper's 2010 data from the Census Bureau's public 2010–2012 files, using exactly the code we used for 2022–2024. We compared the result with the authors' file on four measures. We set each limit before looking at the results:
- each group's share of the population: within 1 percent;
- the mix of occupations: an index of dissimilarity below 0.0114. The index is the share of workers who would have to switch occupations for the two mixes to match. The limit is the index between the 2022 and 2023 surveys, which use the same occupation codes, so it reflects ordinary year-to-year noise;
- relative log wages across groups: within 0.02;
- average earnings: within 1 percent.
The occupation mix and relative wages passed easily. Average earnings did not. Our pre-set method adjusts earnings with both the Census Bureau's own inflation factor and the PCE index, and it left earnings 1.80 percent off. The Census Bureau's larger three-year file left them 1.92 percent off. After seeing these results, we tried the Census Bureau's inflation factor alone. It brought earnings within 0.59 percent, but pushed population shares just past their limit (1.18 percent against 1). No version passed all four tests, so we report the check as failed. In round terms, average earnings came out about 2 percent off the authors' file, and nothing we tried fully closed the gap.
We kept the 2023 results because we could measure what the gap does to them. The estimated frictions do not depend on the overall level of earnings. Neither does the 9.0 percent remaining gain. Lowering 2023 earnings by the size of the gap (1.6 or 1.9 percent) raises the 2010–2023 share from 7.0 to 8.1 or 8.4 percent. So dollar levels carry an uncertainty of 1 to 2 percent, and the share carries more. Race coding matters just as much: counting only non-Hispanic whites as white gives 4.4 percent (see Notes). Across data choices, the 2010–2023 share lies between about 4 and 8 percent.
The price adjustment for 2010
The share after 2010 also depends on a possible error in the paper's price adjustment. The code converts earnings into constant dollars with a price index. The paper's 2010 period comes from a combined 2010–2012 Census file. That file's documentation says its earnings are in 2012 dollars. But the paper's code converts them using the index's 2010 value. If the file is in 2012 dollars, real 2010 earnings come out 4.4 percent too high. The earnings comparison above suggests the file may be closer to 2011 dollars. So we treat the error as a hypothesis, not a finding, and report the share both ways.
The correction lowers the model's 2010 output by the same proportion whether or not frictions fall. So the contribution, the gap between the two, does not change. What changes is how fast the whole economy appears to grow on each side of 2010, and so the share. With the paper's adjustment, falling frictions explain 7.0 percent of 2010–2023 growth and 7.3 percent of 2000–2010 growth. With the corrected adjustment, they explain 5.2 percent of 2010–2023 growth and 29.2 percent of 2000–2010 growth. Frictions did not do more in 2000–2010. The lower 2010 level cuts the model's growth in market GDP per person over that decade to 0.15 percent a year.
If the correction is right, it also affects the paper's own headline. We did not re-run 1960–2010 under the corrected index. But our corrected runs show that the correction scales all 2010 outputs by one proportion. Scaling the 1960–2010 run the same way gives a share of about 43.5 percent, against 41.3 in the same run. So the headline rises by about two points and stays near 40 percent.
Contribution of falling frictions to growth in market GDP per person, 2000–2010 and 2010–2023
| 2000–2010 | 2010–2023 | |
|---|---|---|
| Contribution, percentage points a year (either price adjustment) | 0.04 | 0.06 |
| Actual growth, percent a year, paper's price adjustment | 0.58 | 0.89 |
| Actual growth, percent a year, corrected price adjustment | 0.15 | 1.22 |
| Share of growth from falling frictions, paper's price adjustment | 7.3 | 7.0 |
| Share of growth from falling frictions, corrected price adjustment | 29.2 | 5.2 |
Notes. Both windows come from the same seven-period run of the paper's model, and growth is the model's market GDP per person. Both adjustments use the BEA's price index for personal consumption expenditures (PCE), which the paper's code uses on a 2009 = 100 base. The paper's code divides 2010 earnings by the index's 2010 value, 101.653. The corrected run uses its 2012 value, 106.17 (101.653 × 94.534 / 90.514, the 2012 and 2010 values of the same index on FRED's current 2017 = 100 base). The contribution is the same under both because the correction scales the model's 2010 output, with and without falling frictions, by the same factor. The yearly contribution divides by the 10 and 13 years between periods in the model's code; the Notes give the figures using the middle years of the surveys instead.
Most of the corrected share also comes from white women: 3.8 of the 5.2 points.
The corrected adjustment assumes the paper's 2010 earnings are in 2012 dollars. If they are closer to 2011 dollars, as the earnings comparison suggests, the 2010–2023 share would be about 5.9 percent, between the two reported values. The correction to the paper's 1960–2010 headline would also be smaller than two points. We treat this as a hypothesis, not a finding.
Data sources for the extension studies
The extension studies pulled fresh public data on October 5, 2026. In full:
- U.S. Census Bureau, American Community Survey 1-year Public Use Microdata Sample, person files for 2022, 2023 and 2024 (released September 18, 2023, September 10, 2024 and December 4, 2025), from www2.census.gov/programs-surveys/acs/data/pums.
- U.S. Census Bureau, ACS 1-year PUMS person files for 2010, 2011 and 2012, used to rebuild and check the paper's 2010 data point, and for 2017, 2018 and 2019, used to check the change in how weeks worked are recorded.
- U.S. Census Bureau, ACS 2010–2012 3-year PUMS person file, used as a check on the 2010 data point.
- U.S. Census Bureau, "2018 Occupation Code List and Crosswalk," from www2.census.gov/programs-surveys/demo/guidance/industry-occupation.
- IPUMS USA (Ruggles et al., University of Minnesota), "OCC-OCCSOC crosswalk, 2000 onward," from usa.ipums.org/usa/resources.
- U.S. Bureau of Economic Analysis, Personal Consumption Expenditures chain-type price index (DPCERD3A086NBEA), retrieved from FRED, Federal Reserve Bank of St. Louis.
- U.S. Bureau of Labor Statistics, Consumer Price Index for All Urban Consumers (CPIAUCSL, annual average), retrieved from FRED, used only to carry the paper's minimum-earnings rule into 2023 dollars.
- Hsieh, Hurst, Jones and Klenow (2019), Econometrica 87(5): 1439–1474, data and code: the Matlab model files,
chad_output_file_2019_01_24.csvand2012_extract_composite_main.dta, reused for the 1960–2010 periods and the checks.
The convergence analysis in "The slowdown fits a slow approach to a floor, with caveats" fetched no new data; it works entirely from the extension's estimates.
The full working directory for this paper, with the replication and extension code and outputs, is public at github.com/living-sciences/living-allocation-of-talent.
Cite this report
@misc{econ:allocation-of-talent,
  title        = {The Allocation of Talent and U.S. Economic Growth: Hsieh, Hurst, Jones and Klenow (2019), replicated and extended to 2024},
  year         = {2026},
  howpublished = {Living Science},
  url          = {https://livingscience.ai/econ/living-allocation-of-talent},
  note         = {Replication repository: https://github.com/living-sciences/living-allocation-of-talent},
}
Discussion
Sign in to join the discussion.
Loading discussion…