Democracy Does Cause Growth: Acemoglu, Naidu, Restrepo and Robinson (2019), replicated and extended to 2026
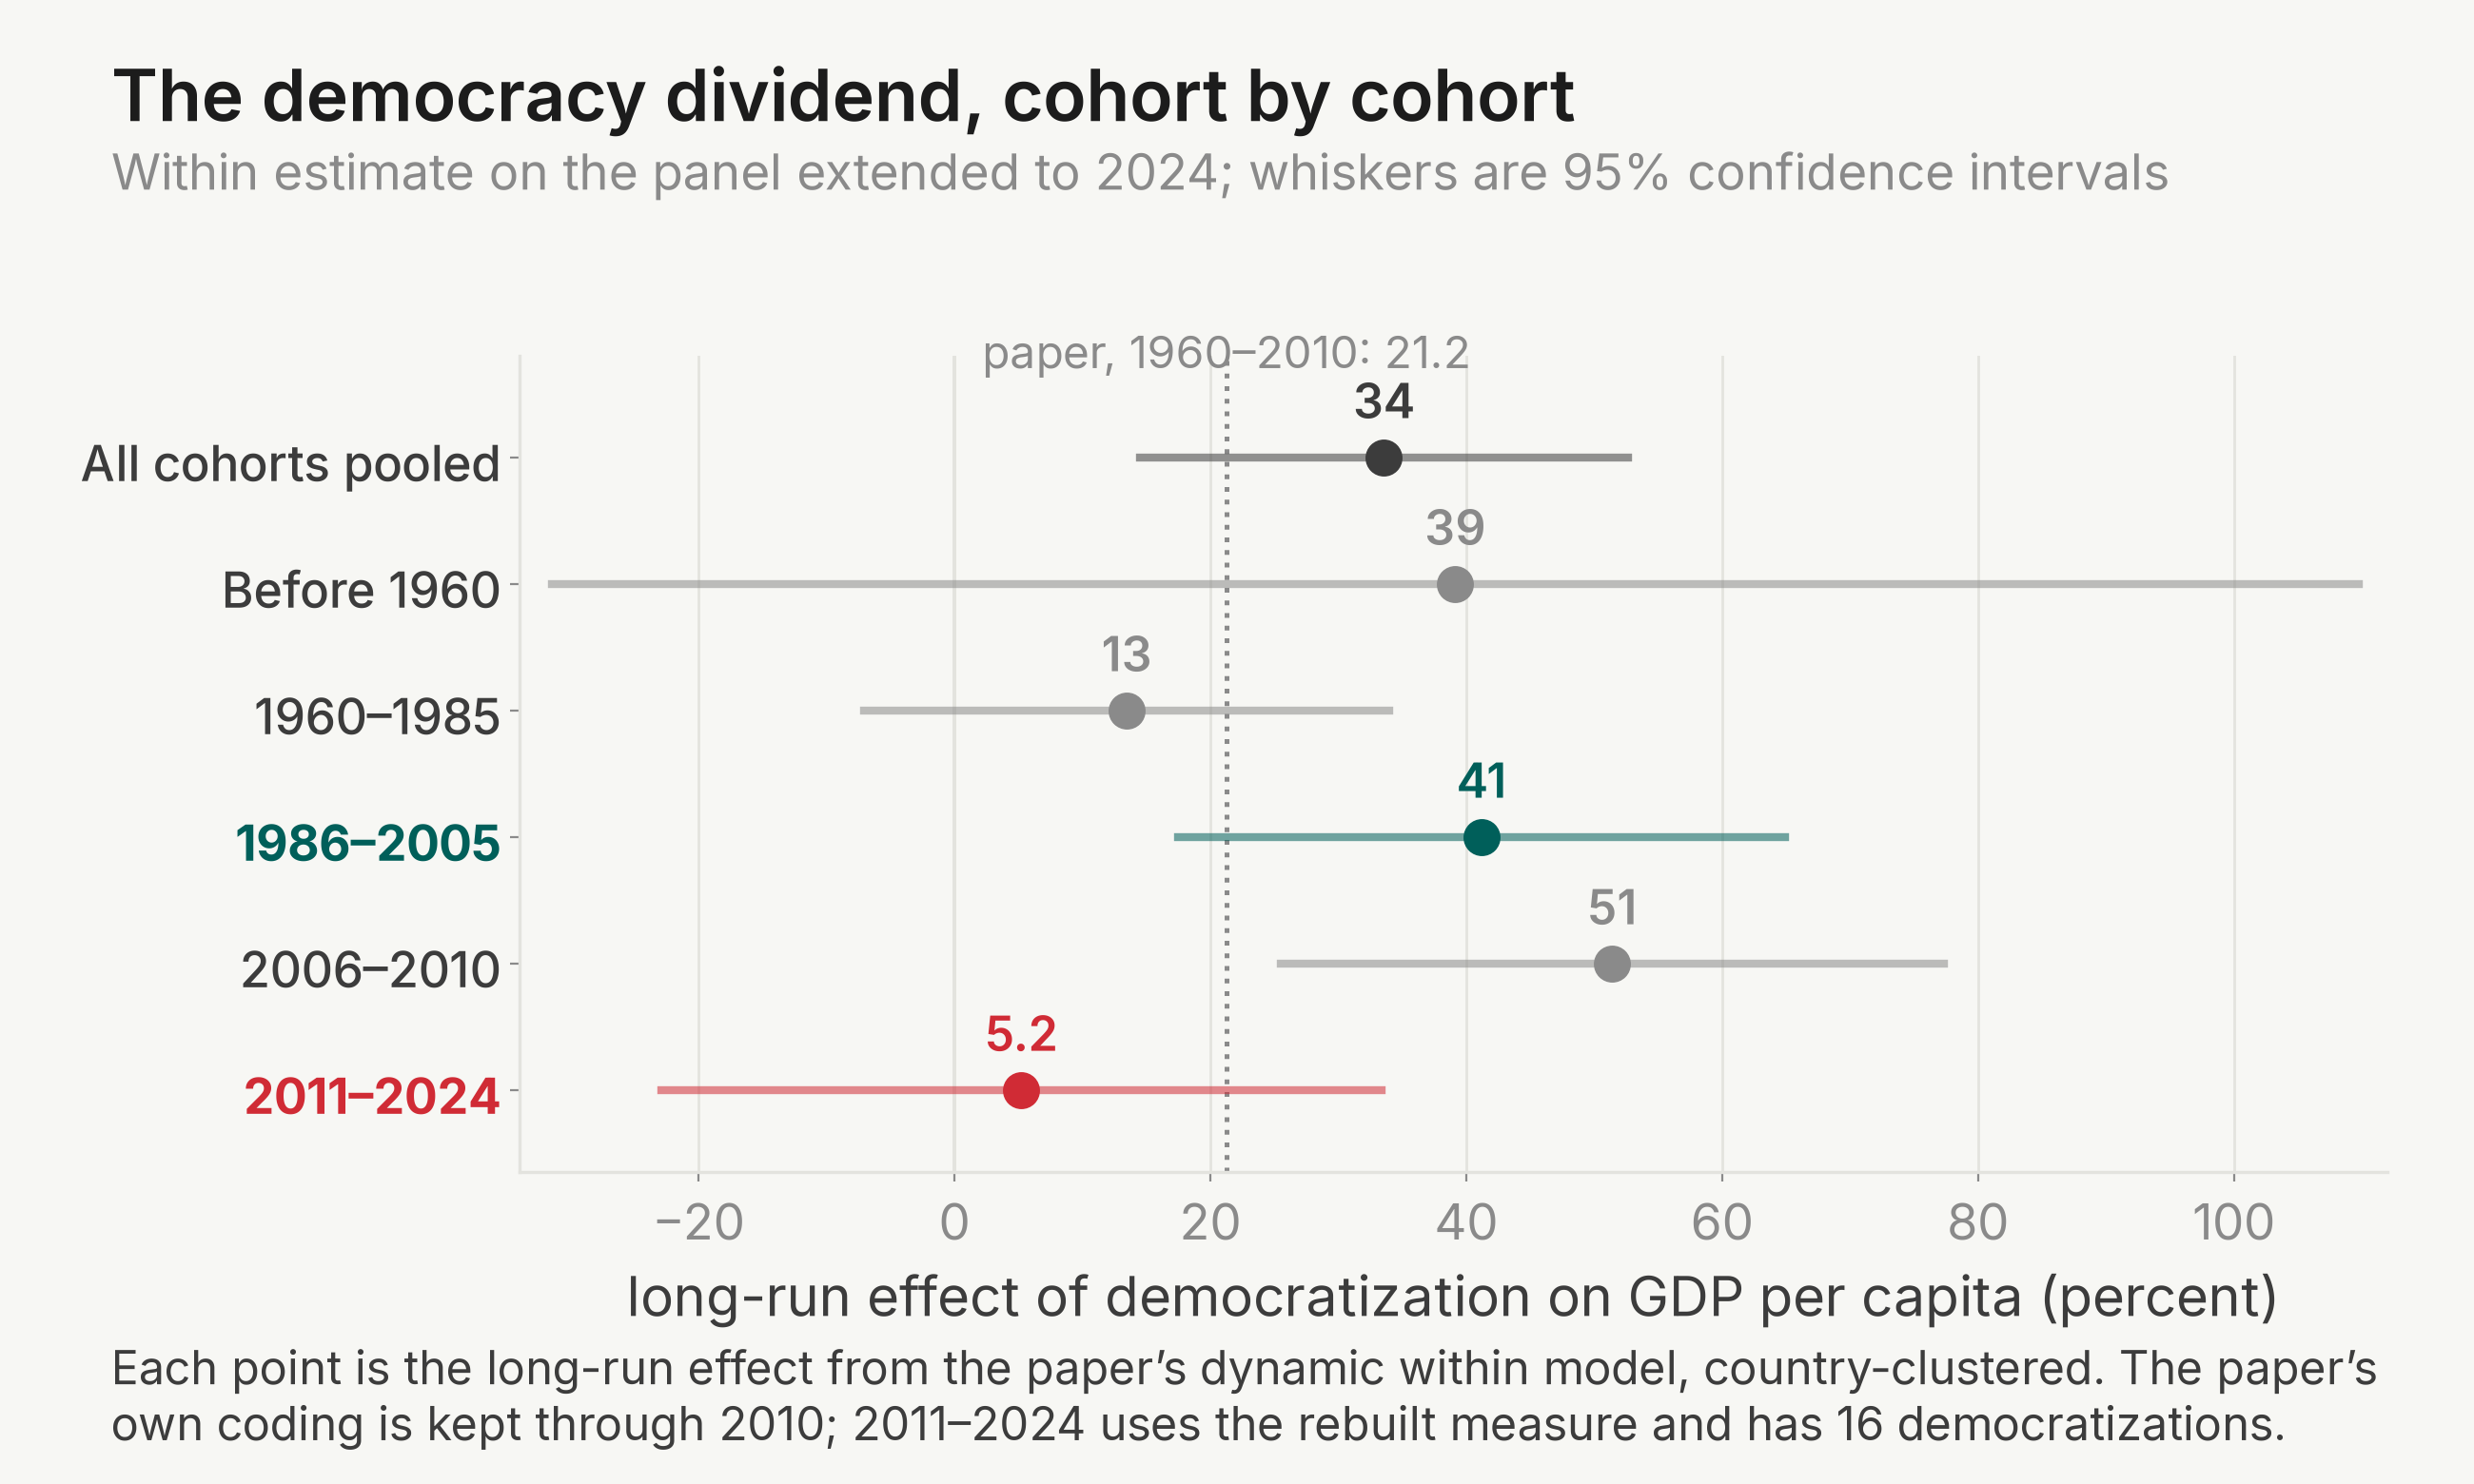
Does democracy make countries richer? Acemoglu, Naidu, Restrepo and Robinson answer with a panel of 175 countries from 1960 to 2010. They build a democracy indicator that consolidates earlier measures, and they control for country effects and the rich dynamics of GDP. The paper finds that a democratization raises GDP per capita by about 20 percent in the long run. The estimate survives a reweighting design and an instrument built from regional waves of democratization. Our extension rebuilds the democracy measure from successor sources, carries the panel to 2024, and finds the pooled long-run estimate grows to 33.6 percent (the paper's own coding kept through 2010, and all three successor measures agree), but only 16 of the 138 democratizations are after 2010, and that cohort's own estimate is 5.2 percent with a 95 percent confidence interval from −23 to 33, so for the newest democracies the question is still open.
The replication in brief
The paper's results reproduce. The authors' code is written in Stata. We did not have access to Stata, so we rewrote the code in R. The preferred estimate came out at a democracy coefficient of 0.787 and a long-run effect of 21.24 percent, the printed values. The instrumental-variables columns reproduce exactly: coefficients 0.966 and 1.149, long-run effects 26.3 and 31.5 percent. The semiparametric effect at 20 to 24 years is 23.7 percent in our run, against the paper's 24. What differs is confined to the Arellano-Bond GMM columns, one weak spatial column, and one summary-statistics table. The appendix has the full comparisons.
A reader's two questions
The paper's panel ends in 2010. A reader asked, through the site, whether the results hold for the countries that democratized in 1986–2005, and whether they are relevant for democracies born after 2010. The two questions get different answers. The 1986–2005 democratizers now carry the largest effect in the sample. The post-2010 democratizers are too few and too young to test. Where the data can speak, their weakness is survival, not growth while democratic.
The 1986–2005 democratizers carry the largest effect
The first answer needs no new data. We split the paper's own 1960–2010 estimate by the cohort in which each democratization occurred.
| Cohort (paper's data, 1960–2010) | Long-run effect | SE |
|---|---|---|
| Democratized before 1960 | 6.9 | 15.5 |
| 1960–1985 | 10.5 | 8.1 |
| 1986–2005 | 28.4 | 9.8 |
| 2006–2010 | 18.3 | 18.9 |
| All cohorts pooled (the paper's estimate) | 21.2 | 7.2 |
The 1986–2005 effect of 28.4 stands against 9.7 for all earlier cohorts pooled. That difference has p = 0.037. The event-study design agrees. In years 0 to 4 after democratization, the 1986–2005 events gain 3.2 (SE 1.8, 68 events). The 1960–1985 events gain 1.6 (SE 1.7, 26 events). So does the instrument, era by era. The 1960–1985 waves give a coefficient of 0.49 (SE 0.61). The 1986–2010 waves give 2.59 (SE 0.70). Both eras have strong first stages (F of 52 and 39).
So the paper's effect is not a relic of the early Cold War sample. It is strongest for exactly the democracies the reader asked about. This holds even though 30 of the 82 democratizations of 1986–2005 had reversed by 2010.
The same analysis on today's data
Extending the panel means rebuilding the democracy measure, because the paper's sources stopped. The Polity project ended with 2018. Our measure keeps the paper's own coding verbatim through 2010. From 2011 to 2018 it applies the paper's consolidation rule to Polity5 and Freedom House. From 2019 to 2024 it replaces the Polity leg with Skaaning's lexical index. The rebuilt rule changes the indicator only from the year a change occurs, so no paper-era value is touched. GDP splices the paper's series with growth rates from the World Bank's constant-2015-dollar series.
To check the rebuilt rule, we also applied it to 1960–2010, where the paper's coding exists. It agrees with the paper's coding on 95.7 percent of country-years. Democratization dates match within a year 62 percent of the time.
On the extended panel, the paper's preferred design gives a democracy coefficient of 0.935 (SE 0.223). The long-run effect is 33.6 percent (SE 9.7), against 21.2 on the paper's years. The instrumented long-run effect is 69.7 percent (SE 28.0, first-stage F 25.3), against 31.5. The growth is monotone in the end year:
| Panel ends in | 2010 | 2014 | 2018 | 2021 | 2024 |
|---|---|---|---|---|---|
| Long-run effect, within | 21.2 | 24.4 | 29.7 | 31.5 | 33.6 |
The word "grows" does not depend on which successor source finishes the series. Under the three successor variants the within estimate is 33.6, 35.1 and 34.1. The instrumented estimate is 69.7, 64.4 and 75.3.
But the pooled estimate answers the pooled question, and the pool is dominated by the paper's own era. Only 16 of the 138 democratizations in the extended panel, 11.6 percent, occur after 2010. The 2011–2024 cohort's own long-run effect is 5.2, with a 95 percent confidence interval from −22.9 to 33.3. The pooled growth comes from the later paper-era cohorts and from higher estimated persistence, not from the new democracies. (On the extended panel, 1986–2005 reaches 41.2 and 2006–2010 reaches 51.4.) The pooled "grows" must not be read as "the new era confirms the paper."
The measure moves the answer as much as the sample
Rebuilding the measure taught us something the extension itself did not ask. The paper's democracy indicator is a yes/no code for each country-year. The paper built it by combining several sources, and some of those sources have since stopped. To continue it, we needed a successor. We considered five candidates, each a different way to code each country-year as democratic or not:
- paper's rule on Polity5: the paper's combination rule, fed with the latest Polity and Freedom House data;
- lexical index rule: the same rule with Skaaning's lexical index in place of Polity (our choice after 2018);
- V-Dem polyarchy threshold: democratic when V-Dem's electoral democracy score is above a cutoff;
- V-Dem Regimes of the World: democratic when V-Dem classifies the country as an electoral or liberal democracy;
- Boix–Miller–Rosato: a separate yes/no coding based on free and fair elections and broad suffrage.
Suppose one of these replaced the paper's coding on the paper's own years, 1960–2010, with the paper's data and design otherwise unchanged. The paper's headline coefficient then moves by a factor of three across candidates:
| Candidate measure, applied to 1960–2010 | Agreement with the paper's coding | Democracy coefficient |
|---|---|---|
| Paper's rule on Polity5 | 0.974 | 0.557 |
| Lexical index rule (used after 2018) | 0.957 | 0.637 |
| V-Dem polyarchy threshold | 0.943 | 0.469 |
| V-Dem Regimes of the World | 0.906 | 0.195 |
| Boix–Miller–Rosato | 0.949 | 0.513 |
Every candidate agrees with the paper's coding on at least 90 percent of country-years. Yet the coefficient spans 0.20 to 0.64, against the paper's 0.787. This is because the design uses only changes within a country. The estimate comes from the years when a country switches status, and those transition years are where the sources most often disagree. Which democracy source a study uses is a first-order choice, as large as adding fourteen years of data. This is why our extension never recodes the paper's years. It changes the measure only by rule, from 2011 on.
The post-2010 democracies cannot be tested yet
Sixteen countries democratized after 2010 on our measure. Their median follow-up is 9 years, and the longest is 13. Nine of the 16 have already reversed. With 15 treated events in the event-study design, effects smaller than 6.9 percentage points cannot be distinguished from zero in years 0 to 4. The paper's own estimate for that window is 2.5. So the design could not have detected the paper's effect in this cohort even if the effect is there.
The estimates land accordingly. Years 0 to 4 give 0.8, with a 95 percent confidence interval from −4.9 to 6.5. Years 5 to 9 give −6.8, with an interval from −25.8 to 12.3; there, anything smaller than 15.9 is undetectable. Years 10 to 14 are not estimable at all. Each interval contains both zero and the paper's value. The honest verdict is that the post-2010 data cannot distinguish no effect from the paper's effect.
Staying democratic is the harder half
Why would the newest democracies disappoint even if the paper is right? The paper's number is the dividend of a permanent democratization. A country only collects it while it stays democratic. We wrote this down as a model. The expected GDP path of a democratization is the dividend if the spell were permanent, multiplied by the probability the spell is still alive. The first factor comes from the paper's dynamic design, cohort by cohort. The second is a survival curve of democratic spells.
The two factors behave very differently across cohorts. The dividend-while-democratic is large for every cohort since 1986. A test that all five cohort effects are equal rejects, with p = 0.012. Survival is where the post-2010 cohort stands apart. Ten years after the transition, 73 percent of the 1986–2005 democracies were still democratic. Of the post-2010 democracies, 39 percent were.
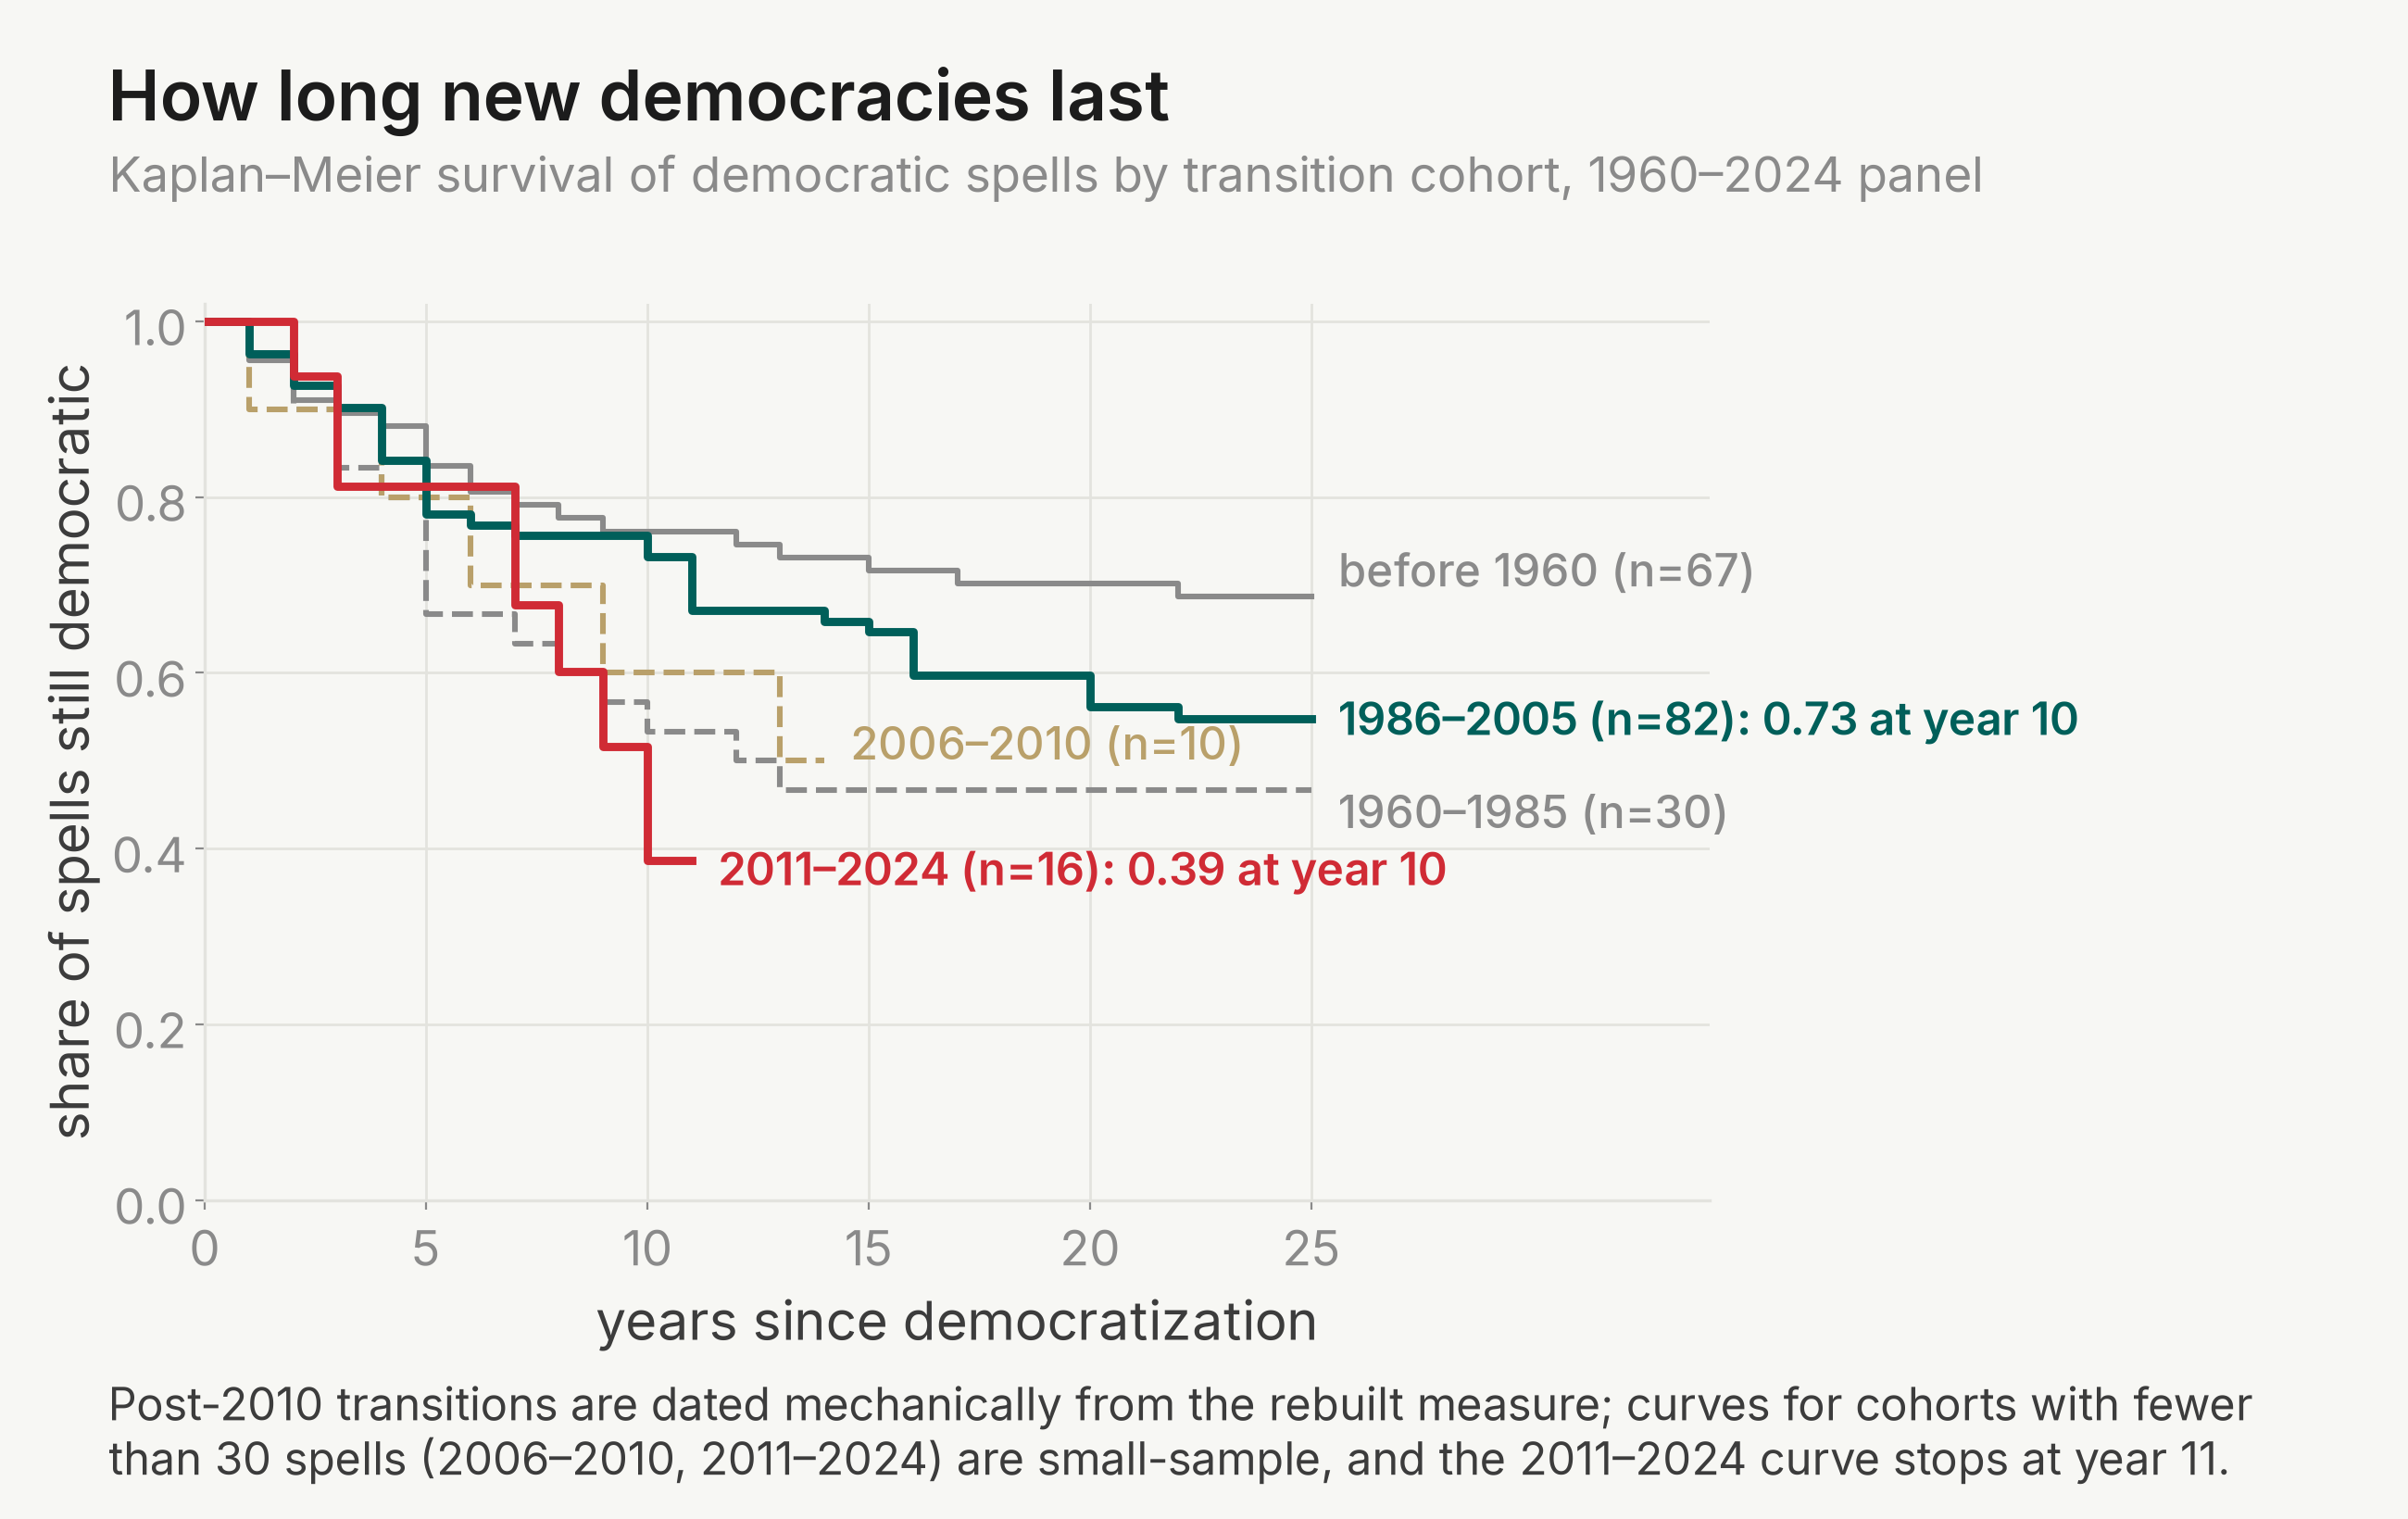
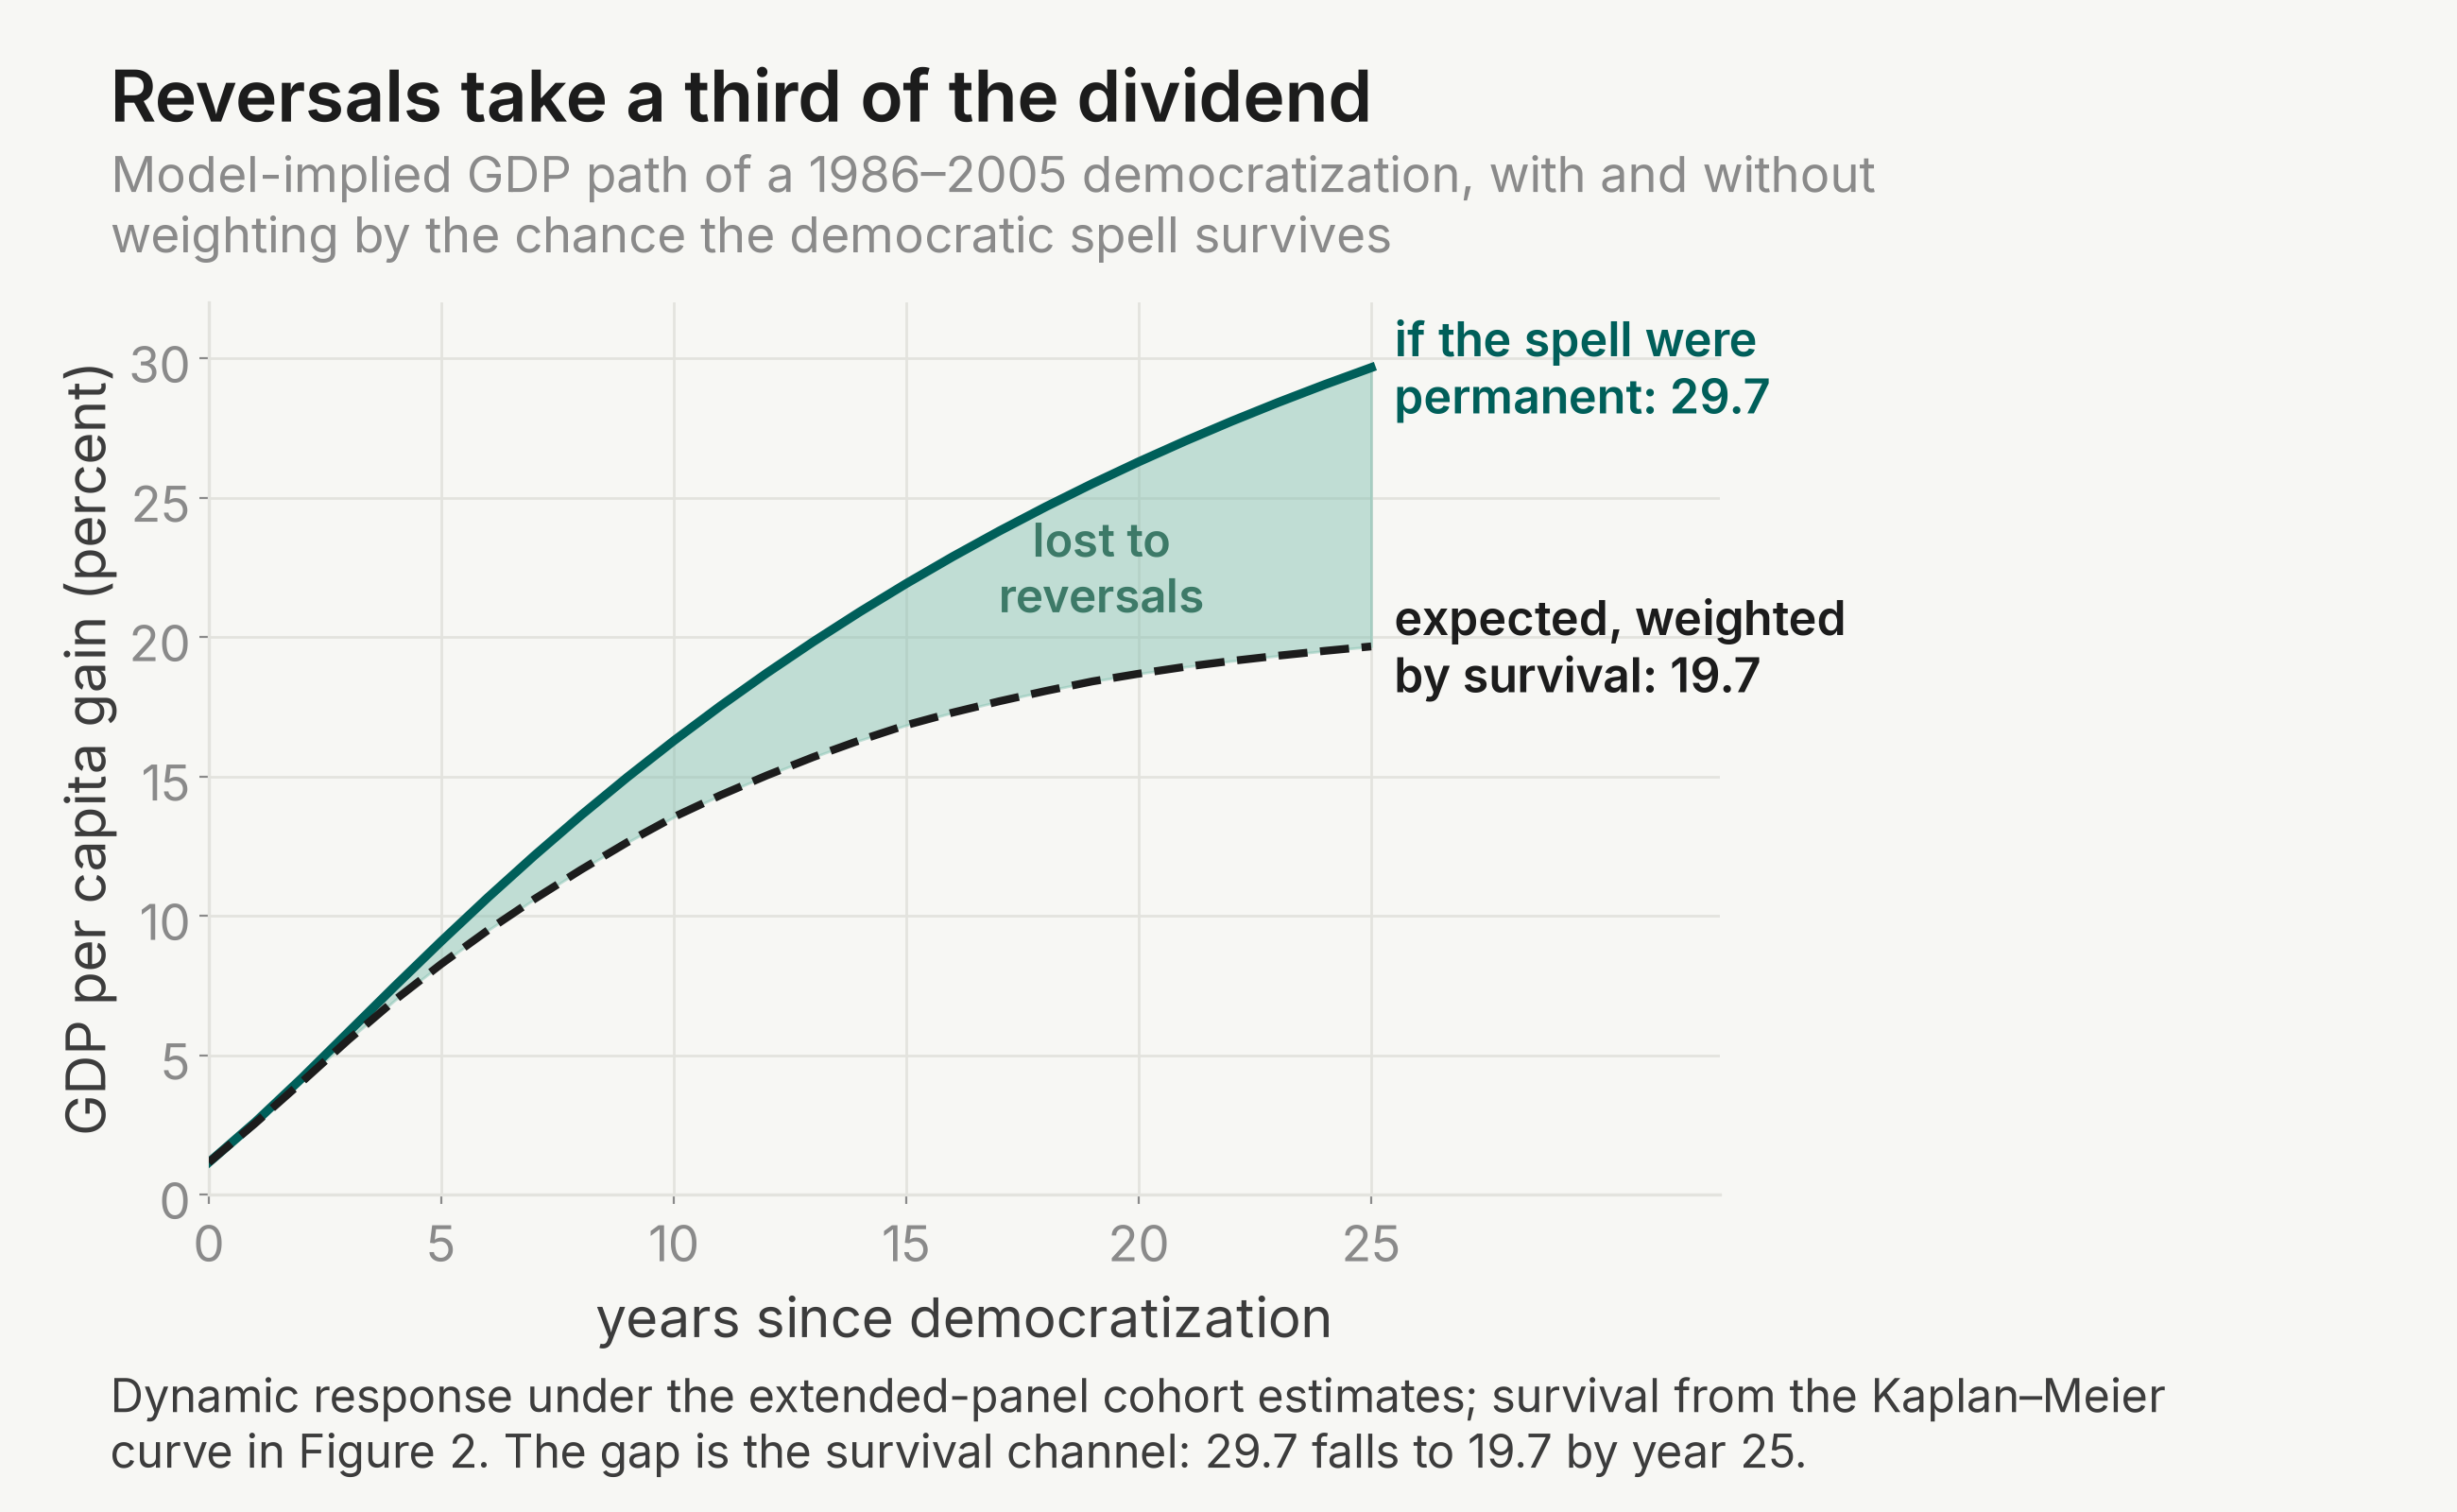
Reversals are expensive even for the durable cohorts. For a 1986–2005 democratization, the permanent dividend reaches 29.7 percent by year 25. Weighted by the cohort's own survival, the expected gain is 19.7 percent. So reversals remove about a third of the dividend, in the cohort where democracy lasted best.
The model also gives an out-of-sample test. We fitted it on 1960–2010 only and predicted the post-2010 event-study path. For years 0 to 4 it predicts a gain of 2.7 (3.6 when using the 1986–2005 dividend). The post-2010 data show 0.8, with an interval from −4.9 to 6.5. The prediction lands inside the interval. So the paper-era model is consistent with the post-2010 democracies in the only window the data can judge. The later windows are uninformative, not contradictory. Isolating the survival factor shows it is negligible in the first five years. By years 10 to 13 it costs about 3.6 points: the permanent path of 11.2 falls to 7.6 under the reversals actually observed. The post-2010 democracies look on track while democratic. What differs is how many of them stay democratic long enough to collect.
The model makes three predictions that new data can falsify by about 2030:
- The 2011–2018 democratizers' event-study gain at years 5 to 9 reaches about 6.6 percent, between 3 and 9, once ten of them are old enough to measure.
- The post-2010 reversals drag the cohort's cumulative gain at year 10 about 2.5 points below its permanent path, between 2 and 4 points (10.2 if permanent, 7.7 expected).
- On a panel reaching 2030, the 1986–2005 cohort's long-run effect stays near 42, between 35 and 48, rather than reverting to the pooled 21.
How this relates to later research
Campos, Coricelli and Frigerio (2026, Economics & Politics) is the nearest neighbour, and it reached 2024 first: ours is not the first extension of this paper to 2024. They code regimes three ways: democracy, hybrid and autocracy. Moving from hybrid to democracy carries a long-run gain of 24.1 (SE 10.2), beside our pooled 33.6 under the paper's binary coding. The treatments differ, so we read the two as agreeing in sign and scale, not as the same number.
Narita (2025, preprint) reports that the paper's design weakens in windows that start later: a long-run effect of 6.1 (SE 8.6) from 1995 and −2.1 (SE 6.7) from 2001. On our measure the same windows give 16.0 and 10.3. Part of the decline in both is mechanical. Shorter panels bias dynamic-panel persistence downward (Nickell bias). The split-panel jackknife correction of Chen, Chernozhukov and Fernández-Val (2019, AEA Papers and Proceedings) moves our window estimates away from zero, not toward it: from 16.0 to 24.2, and from 10.3 to 12.1. Before trusting the correction, we reproduced its published values on the paper's balanced 1987–2009 subpanel: 16.05 and 25.30, against their 16.05 and 25.69. On a balanced 1987–2024 panel it gives 24.9 uncorrected and 40.4 corrected. So we do not reproduce a near-zero recent effect, though the wide standard errors mean the point estimates do not formally disagree.
Eberhardt (2022, European Economic Review) argues the effect is heterogeneous across countries, at 16.6 (SE 4.6) under his mean-group estimator. On our extended measure, that estimator is dominated by near-unit-root country fits, and its central tendency is near zero. Pooling only the countries that changed regime gives 28.6 on the paper's years. Our cohort results point the same way as his message: a single pooled number hides large, real variation in who gains.
Imai, Kim and Wang (2023, American Journal of Political Science) estimate, with a matching design, that reversals cost about 5 to 8 percent of GDP within five years. Our reversal event study gives −5.5 percent at years 0 to 4, inside their band. This is the cost that powers the survival channel above.
None of these studies, and neither of our extension studies, tests why post-2010 democracies reverse faster. The survival finding describes the hazard; it does not explain it.
Notes
These are the judgment calls and data limits behind our numbers, so you can decide how much weight each result deserves.
- We set the minimum agreement the rebuilt measure had to reach (with the paper's coding on 1960–2010) after we had already seen the agreement values. So passing that check shows little about whether the successor sources code democracy correctly. The candidate table in the measure section gives a better sense of how much the choice of source matters.
- Post-2010 democratization and reversal dates come mechanically from the rebuilt rule, with no case-by-case reading of events. The paper hand-checked its 1960–2010 coding. The survival curves and every prediction built on them inherit this.
- The post-2010 survival estimate drops to zero at year 12. This is a small-sample artefact: the oldest post-2010 spell is 13 years old, so the at-risk set runs out. Figure 2 stops the curve at year 11 for this reason.
- The 2006–2010 cohort (10 spells) and 2011–2024 cohort (16 spells) are too thin for cohort-specific hazard curves. The model gives them proportional shifts on the common baseline.
- COVID years do not drive the extended estimate. Excluding 2020–2021 gives a long-run effect of 33.8. Adding region-by-year effects for 2019–2024 gives 31.2, against the headline 33.6.
- The cohort contrast survives a fully mechanical recoding of both eras. Under one rule applied throughout 1960–2024, the long-run effect is 14.5 on the paper's years and 25.8 extended. The 2011–2024 cohort gives 0.75, against 32.7 for 1986–2005.
- GDP after 2010 splices the paper's series with World Bank growth rates in constant 2015 dollars; the paper's constant-2000 series is discontinued. A Penn World Table join is a sensitivity and runs lower on the paper's era (coefficient 0.49). The join correlation check passed at 0.925.
- In our instrumented runs the over-identification p-value is 0.10, against the paper's 0.21. Coefficients, standard errors and first-stage F match.
- Some of the paper's control and channel variables are discontinued, so we used labelled substitutes. The Fraser economic-freedom index stands in for the market-reforms index; it is a different construct, and it is the one channel that does not agree. IMF and UNU-WIDER series stand in for taxes, and a composite of V-Dem, conflict and coup data for unrest. The external-wealth control matches countries by name, with 74 percent coverage after 2010.
- The post-2010 power calculation takes its standard error from pre-transition placebo windows of the same bootstrap. These depend only on pre-transition outcomes.
- A variant of the dividend model with cohort-specific persistence is not identified on this data. Its cohort effects span −38 to +112, with standard errors of 50 to 110. The reported model shares one persistence parameter, 0.972, across cohorts.
- The second extension study fits and tests the model. It fetched no new data and works entirely from the first study's panel and the authors' files.
Appendix: replication details
What we were able to do
We used the authors' data and code: the country-year panel DDCGdata_final.dta (24 MB), the Stata programs for every table and figure, and the geographic data behind the spatial columns. The authors also shipped their result tables, which match the paper's printed values. We did not have access to Stata, so none of the shipped code was run as written. We rewrote the code in R (fixest, plm, haven), porting the authors' programs line by line. This included their HHK minimum-distance routine and its cluster bootstrap (seed 12345, 100 replications).
We compared every estimate with the paper's printed tables and the authors' shipped results. Two of the authors' specifications required judgment to run at all. The spatial column of Table 6 lists the same GDP lags as both endogenous regressors and instruments, and we had to reclassify them to estimate it. The difference-GMM command is numerically singular as written with two-way effects, and we recovered it by demeaning years first. Both reformulations are reported below where they matter.
For the extension, we rebuilt the democracy measure from the V-Dem v16 dataset, which carries the Polity5, Freedom House and lexical-index series, with Boix–Miller–Rosato as a fallback. We spliced GDP with World Bank growth rates. Before any new estimate, the extended panel had to reproduce the paper-era anchors exactly: coefficient 0.787, long-run effect 21.24, 6,336 observations, 175 countries. The rebuilt instrument had to match the paper's construction to rounding. It did both.
The paper's main claims
- A democratization raises long-run GDP per capita by about 20 percent: democracy coefficient 0.787 (SE 0.226), long-run effect 21.24 percent (SE 7.21) in the preferred four-lag within specification.
- Instrumenting democracy with regional democratization waves gives long-run effects of 26.3 to 31.5 percent (coefficients 0.966, SE 0.558, and 1.149, SE 0.554), with first-stage F-statistics of 119.1 and 33.2.
- Semiparametric estimates show GDP about 24 percent higher (SE 7.7) 20 to 24 years after democratization, with no pre-democratization trend.
- The effect is positive across estimators (within, Arellano-Bond GMM, HHK) and robust to controls for initial income, Soviet collapse, unrest, trade and demographics.
- Democracy raises investment, economic reforms, tax revenue, schooling and health, and lowers social unrest, with no significant effect through TFP.
- The effect does not depend on a country's income level; only the interaction with secondary schooling is positive and significant.
- The measure covers 184 countries and identifies 122 democratizations and 71 reversals, with the democratic share rising from 31.5 percent in 1960 to 64.1 percent in 2010. The estimation panel has 175 countries observed 38.8 years on average.
What we got when we re-ran it
The paper's three headline designs reproduce. The preferred within estimate, the two instrumented columns, and the semiparametric averages come out at the printed values or within one standard error. The following also reproduce exactly:
- the first-stage F-statistics, 119.1 and 33.2;
- all eight robustness columns of Table 4;
- all nine channel coefficients of Table 7;
- all eight heterogeneity columns of Table 8;
- the descriptive facts: 184 countries, 122 democratizations, 71 reversals, democratic share 31.5 to 64.1 percent.
The figures reproduce their patterns: the dip and recovery around democratization, the forward-iterated path plateauing near 20 percent, the flat semiparametric pre-trends, and the regional waves. GDP is stationary in our runs, as the paper reports. Unit roots are rejected in all four within columns, and persistence stays below 1.
| Paper | Ours | |
|---|---|---|
| Within, four lags: democracy coefficient | 0.787 (0.226) | 0.787 (0.226) |
| Within, four lags: long-run effect, percent | 21.24 (7.21) | 21.24 (7.21) |
| 2SLS, col. 1: democracy coefficient | 0.966 (0.558) | 0.966 (0.562) |
| 2SLS, col. 2: democracy coefficient | 1.149 (0.554) | 1.149 (0.558) |
| 2SLS, col. 2: long-run effect, percent | 31.5 | 31.5 |
| Semiparametric, years 20–24, percent | 24.0 (7.7) | 23.7 (8.4) |
| GMM, four lags: long-run effect, percent | 16.45 (8.44) | 8.06 (9.68) |
| HHK, four lags: long-run effect, percent | 25.03 (10.58) | 27.37 (14.68) |
| Table 6 col. 9 (spatial): democracy coefficient | 1.361 | 0.907 |
Notes. Ours in italics. Standard errors in parentheses, clustered by country. The within row is Table 2 column 3 (6,336 observations, 175 countries); sample sizes match the paper throughout. The semiparametric row averages the three estimators (regression adjustment, reweighting, doubly robust); each is within one standard error of the paper. The GMM and spatial rows are the divergences discussed below.
Three things differ, and none touches the paper's conclusions.
- The Arellano-Bond GMM columns of Tables 2, 3 and 7 come out lower. For example, the four-lag long-run effect is 8.06 (SE 9.68) against the paper's 16.45 (SE 8.44), still within one of the paper's standard errors. The cause is software, not the paper. On this heavily over-identified design the one-step weight matrix is singular, and R and Stata resolve the singularity with different generalized inverses. Sample sizes and the AR(2) serial-correlation tests match the paper. The authors' own readme warns that these columns are software-sensitive. The HHK columns, the paper's other dynamic estimator, match on point estimates; their bootstrap standard errors run larger, as the readme anticipates for changed library versions.
- Column 9 of Table 6, a spatial robustness column, lists the GDP lags as endogenous to themselves. Re-classifying them to make the model estimable gives 0.907, against the printed 1.361. The column has a weak first stage in the paper itself (F of 4.6) and carries none of the paper's conclusions.
- Our first pass at the Table 1 summary statistics computed each variable's mean over all its non-missing rows. The paper restricts to the regression sample. Two cells fell outside tolerance, for example market reforms for nondemocracies at 21.89 against 26.89. Restricting to the regression sample reproduces the paper's means and counts exactly. So this was a fault in our script, not in the paper.
We did not re-run the paper's reversal-symmetry claim, that reversals mirror democratizations. The reversal estimates in the extension speak to it instead.
Data sources for the extension studies
The extension studies pulled fresh public data on October 14, 2026. In full:
- V-Dem Institute, Varieties of Democracy dataset v16 (country-year, release of March 17, 2026), via the vdemdata R package: the Freedom House status, Polity5 (
e_polity2, Marshall and Gurr, through 2018), lexical index of electoral democracy (Skaaning, through 2024), polyarchy and Regimes of the World series, and the contention variables used in the unrest composite. - Boix, Miller and Rosato, dichotomous democracy measure v4.0 (1800–2020), from the authors' distribution.
- World Bank, World Development Indicators: GDP per capita in constant 2015 US$ (
NY.GDP.PCAP.KD, API vintage of October 8, 2026), plus investment, trade, child mortality, school enrolment and population-structure series for the control and channel substitutes. - Groningen Growth and Development Centre, Penn World Table 11.0 (DataverseNL, released October 10, 2025): national-accounts GDP per capita, used as a sensitivity.
- IMF Fiscal Affairs Department, World Revenue Longitudinal Data 3.0.1 (February 2026): tax revenue share of GDP.
- UNU-WIDER Government Revenue Dataset 2023, as a cross-check on the tax series.
- Fraser Institute, Economic Freedom of the World, 2026 edition: the chain-linked summary index, substituting for the paper's discontinued market-reforms index.
- Lane and Milesi-Ferretti, External Wealth of Nations, year-end 2024 (Brookings): net international investment position over GDP.
- UCDP/PRIO Armed Conflict Dataset v26.1 and Cline Center Coup d'État Project v2.2.2 (February 2026): intrastate conflict and coup events for the unrest composite.
- Acemoglu, Naidu, Restrepo and Robinson (2019), data and code from the author's MIT data archive:
DDCGdata_final.dtaand the Stata programs, reused for all 1960–2010 values.
The second extension study (the dividend model) fetched no new data; it works from the first study's extended panel, the authors' files, and published estimates from the papers cited above, each traced to its source table.
The full working directory for this paper, with the replication and extension code and outputs, is public at github.com/living-sciences/living-democracy-growth.
Cite this report
@misc{econ:democracy-growth,
  title        = {Democracy Does Cause Growth: Acemoglu, Naidu, Restrepo and Robinson (2019), replicated and extended to 2026},
  year         = {2026},
  howpublished = {Living Science},
  url          = {https://livingscience.ai/econ/living-democracy-growth},
  note         = {Replication repository: https://github.com/living-sciences/living-democracy-growth},
}
Discussion
Sign in to join the discussion.
Loading discussion…