Are Ideas Getting Harder to Find? Bloom, Jones, Van Reenen and Webb (2020), replicated and extended to 2026
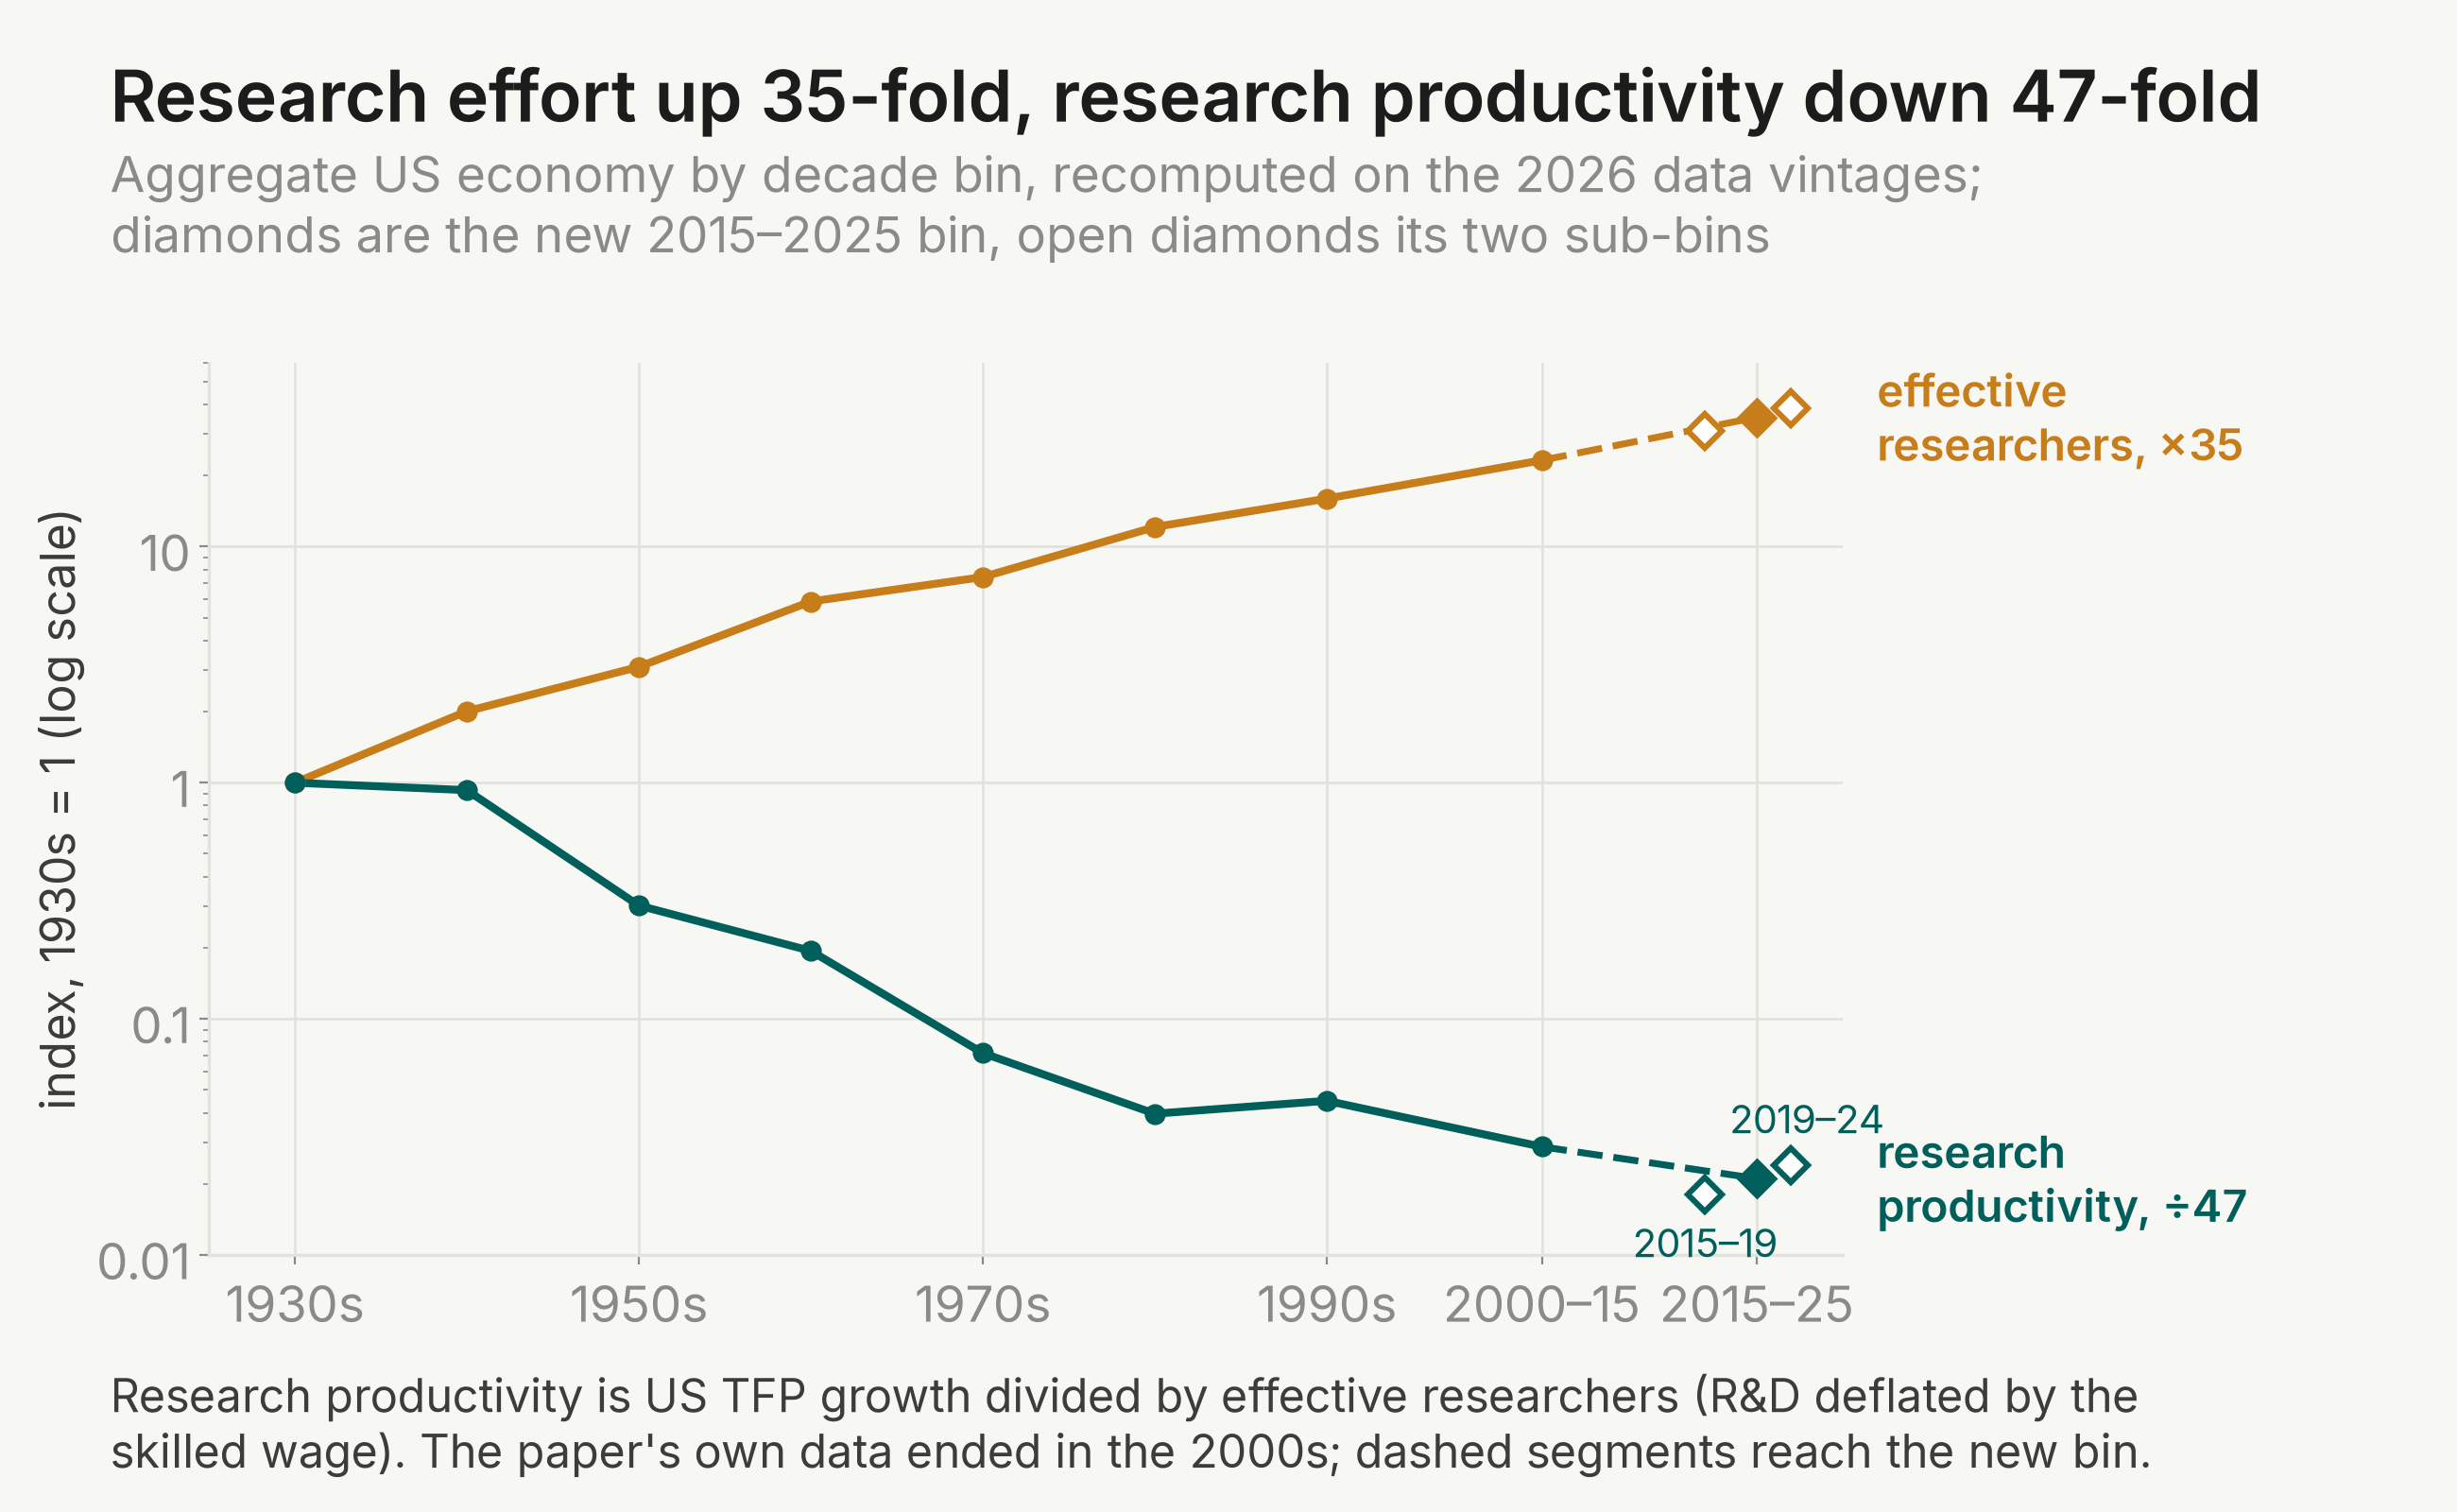
Exponential growth comes from ideas, and ideas come from researchers. Bloom, Jones, Van Reenen and Webb measure research productivity as idea output per effective researcher. Effective researchers are R&D spending deflated by the skilled wage. They apply this one accounting to the aggregate US economy, Moore's law, crop yields, new drugs, disease and firms. For the aggregate economy, research effort rose by a factor of 23 since the 1930s. Research productivity fell by a factor of 41, about 5.1 percent a year. Doubling computer-chip density now takes more than 18 times the researchers it took in the early 1970s. Our extension re-runs the paper's arithmetic on the newest 2024–2025 data and asks whether AI can produce more growth from the same research effort: research productivity is still falling almost everywhere (aggregate −2.5 percent a year for 2015–2025, and −4.9 in the clean pre-pandemic 2015–2019 step), and the first AI-era years bound AI's contribution to US TFP growth between −1.1 and +3.8 percentage points a year, an interval that contains zero.
The paper's main claims
- For the aggregate US economy, the effective number of researchers grew 23-fold since the 1930s, 4.3 percent a year. Research productivity, TFP growth per effective researcher, fell 41-fold, 5.1 percent a year. Holding growth constant therefore requires doubling research effort every 13 years.
- For Moore's law, chip density grows a steady 35 percent a year, but the effective research behind it rose 18-fold over 1971–2014. Research productivity fell 6.8 percent a year.
- Semiconductor industry TFP points the same way: research productivity fell 5.6 percent a year over 1975–2011 on the broad R&D measure.
- For seed yields over 1969–2009, research productivity fell 9.9 percent a year for corn, 7.3 for soybeans, 3.4 for cotton and 6.1 for wheat. These rates count seed-efficiency research. Counting crop-protection research too gives declines of 6.2 for corn, 4.4 for soybeans and 3.3 for wheat, and a 1.3 percent rise for cotton.
- For new drugs, research productivity in new molecular entities approved by the FDA fell 3.5 percent a year over 1970–2015.
- For medical research the idea output is years of life saved. Research productivity fell for cancer and heart disease whether effort is publications or clinical trials. By those two measures, the summary table's yearly declines are 0.6 and 5.7 percent for cancer, 6.1 and 10.1 for breast cancer, and 3.7 and 7.2 for heart disease.
- At the firm level, research productivity fell about 10 percent a year in Compustat firms and about 8 percent in the US Census of Manufacturing.
- Together: steady growth has been possible only because research effort rises fast enough to offset falling research productivity.
Each rate is an endpoint ratio or a trend over the stated window. The paper attaches no standard errors to them.
What we were able to do
We used the authors' data and code, the IdeaPFPrograms package of August 2017 (18 MB). It contains one MATLAB module per case: AggregateBLSIPP.m, IntelGraph.m, SeedYields.m, NMEGraph.m and the mortality scripts. Most input data are embedded in them as matrices. The package also carries the skilled-wage series WageScientistData.mat and the crop workbook Seed data v6.xlsx.
We ran the code under Octave and compared every printed table and log against the paper. Three compatibility fixes were needed in the plotting layer; no calculation was changed. The licensed Compustat extract and the restricted Census microdata are not in the package, so the firm-level results could not be run.
For the extension, we ported the paper's arithmetic to Python. Before touching any new data, we required the port to reproduce the authors' own output logs exactly. It did, to the printed precision, including the appendix case that lowers the duplication parameter. We then re-ran the same arithmetic on the newest public vintages:
- BLS total factor productivity, with its R&D add-back rows, to 2024;
- BEA investment series and Census skilled wages to 2025;
- SEC filings for semiconductor R&D to 2025;
- USDA crop yields to 2025 and FDA drug approvals to 2025;
- PubMed, SEER and life-table data to the latest releases.
Every join between an old and a new vintage was checked on the overlap years. A second study added the AI analysis, with its detection limits computed before any AI-era estimate.
What we got when we re-ran it
Everything the package can produce reproduces to rounding. Our run gives the aggregate decline as 5.13 percent a year, a factor of 41.38, from a 22.98-fold rise in effort. The paper prints 5.1, 41 and 23. All six Moore's-law rows of Table 1's top panel match exactly. So do the eight crop rows of Table 2 and all 24 medical cells of Table 3. The diminishing-returns elasticities of Table 7 and the appendix robustness table match as well.
| Research productivity growth, percent a year | Paper | Ours |
|---|---|---|
| Aggregate US economy | −5.1 | −5.13 |
| Moore's law (broad R&D) | −6.8 | −6.80 |
| Corn, soybeans, cotton, wheat (seed-efficiency) | −9.9 / −7.3 / −3.4 / −6.1 | −9.89 / −7.33 / −3.36 / −6.10 |
| New drugs (NMEs) | −3.5 | −3.54 |
| Cancer: publications / clinical trials | −0.6 / −5.1 | −0.59 / −5.08 |
| Breast cancer: publications / clinical trials | −6.8 / −10.1 | −6.77 / −10.05 |
| Heart disease: publications / clinical trials | −3.7 / −7.2 | −3.70 / −7.18 |
| Semiconductor TFP | −5.6 | n.a. |
| Agriculture as a whole (US) | −3.7 | n.a. |
| Compustat firms | −11.1 | n.a. |
| Census of Manufacturing firms | −7.8 | n.a. |
Notes. Italicised values are our re-run of the authors' code. The cancer and breast-cancer rows quote the paper's Table 3. Its summary Table 7 prints −5.7 and −6.1 for two of those cells. Our run confirms the Table 3 values, so the Table 7 entries are the ones in error. The semiconductor-TFP and agriculture-as-a-whole rows have no producing code or data anywhere in the package (8 of Table 2's 40 cells). So we could not attempt them. The two firm-level rows need licensed Compustat and restricted Census microdata that the authors were not permitted to redistribute. We did not test them.
The same analysis on today's data
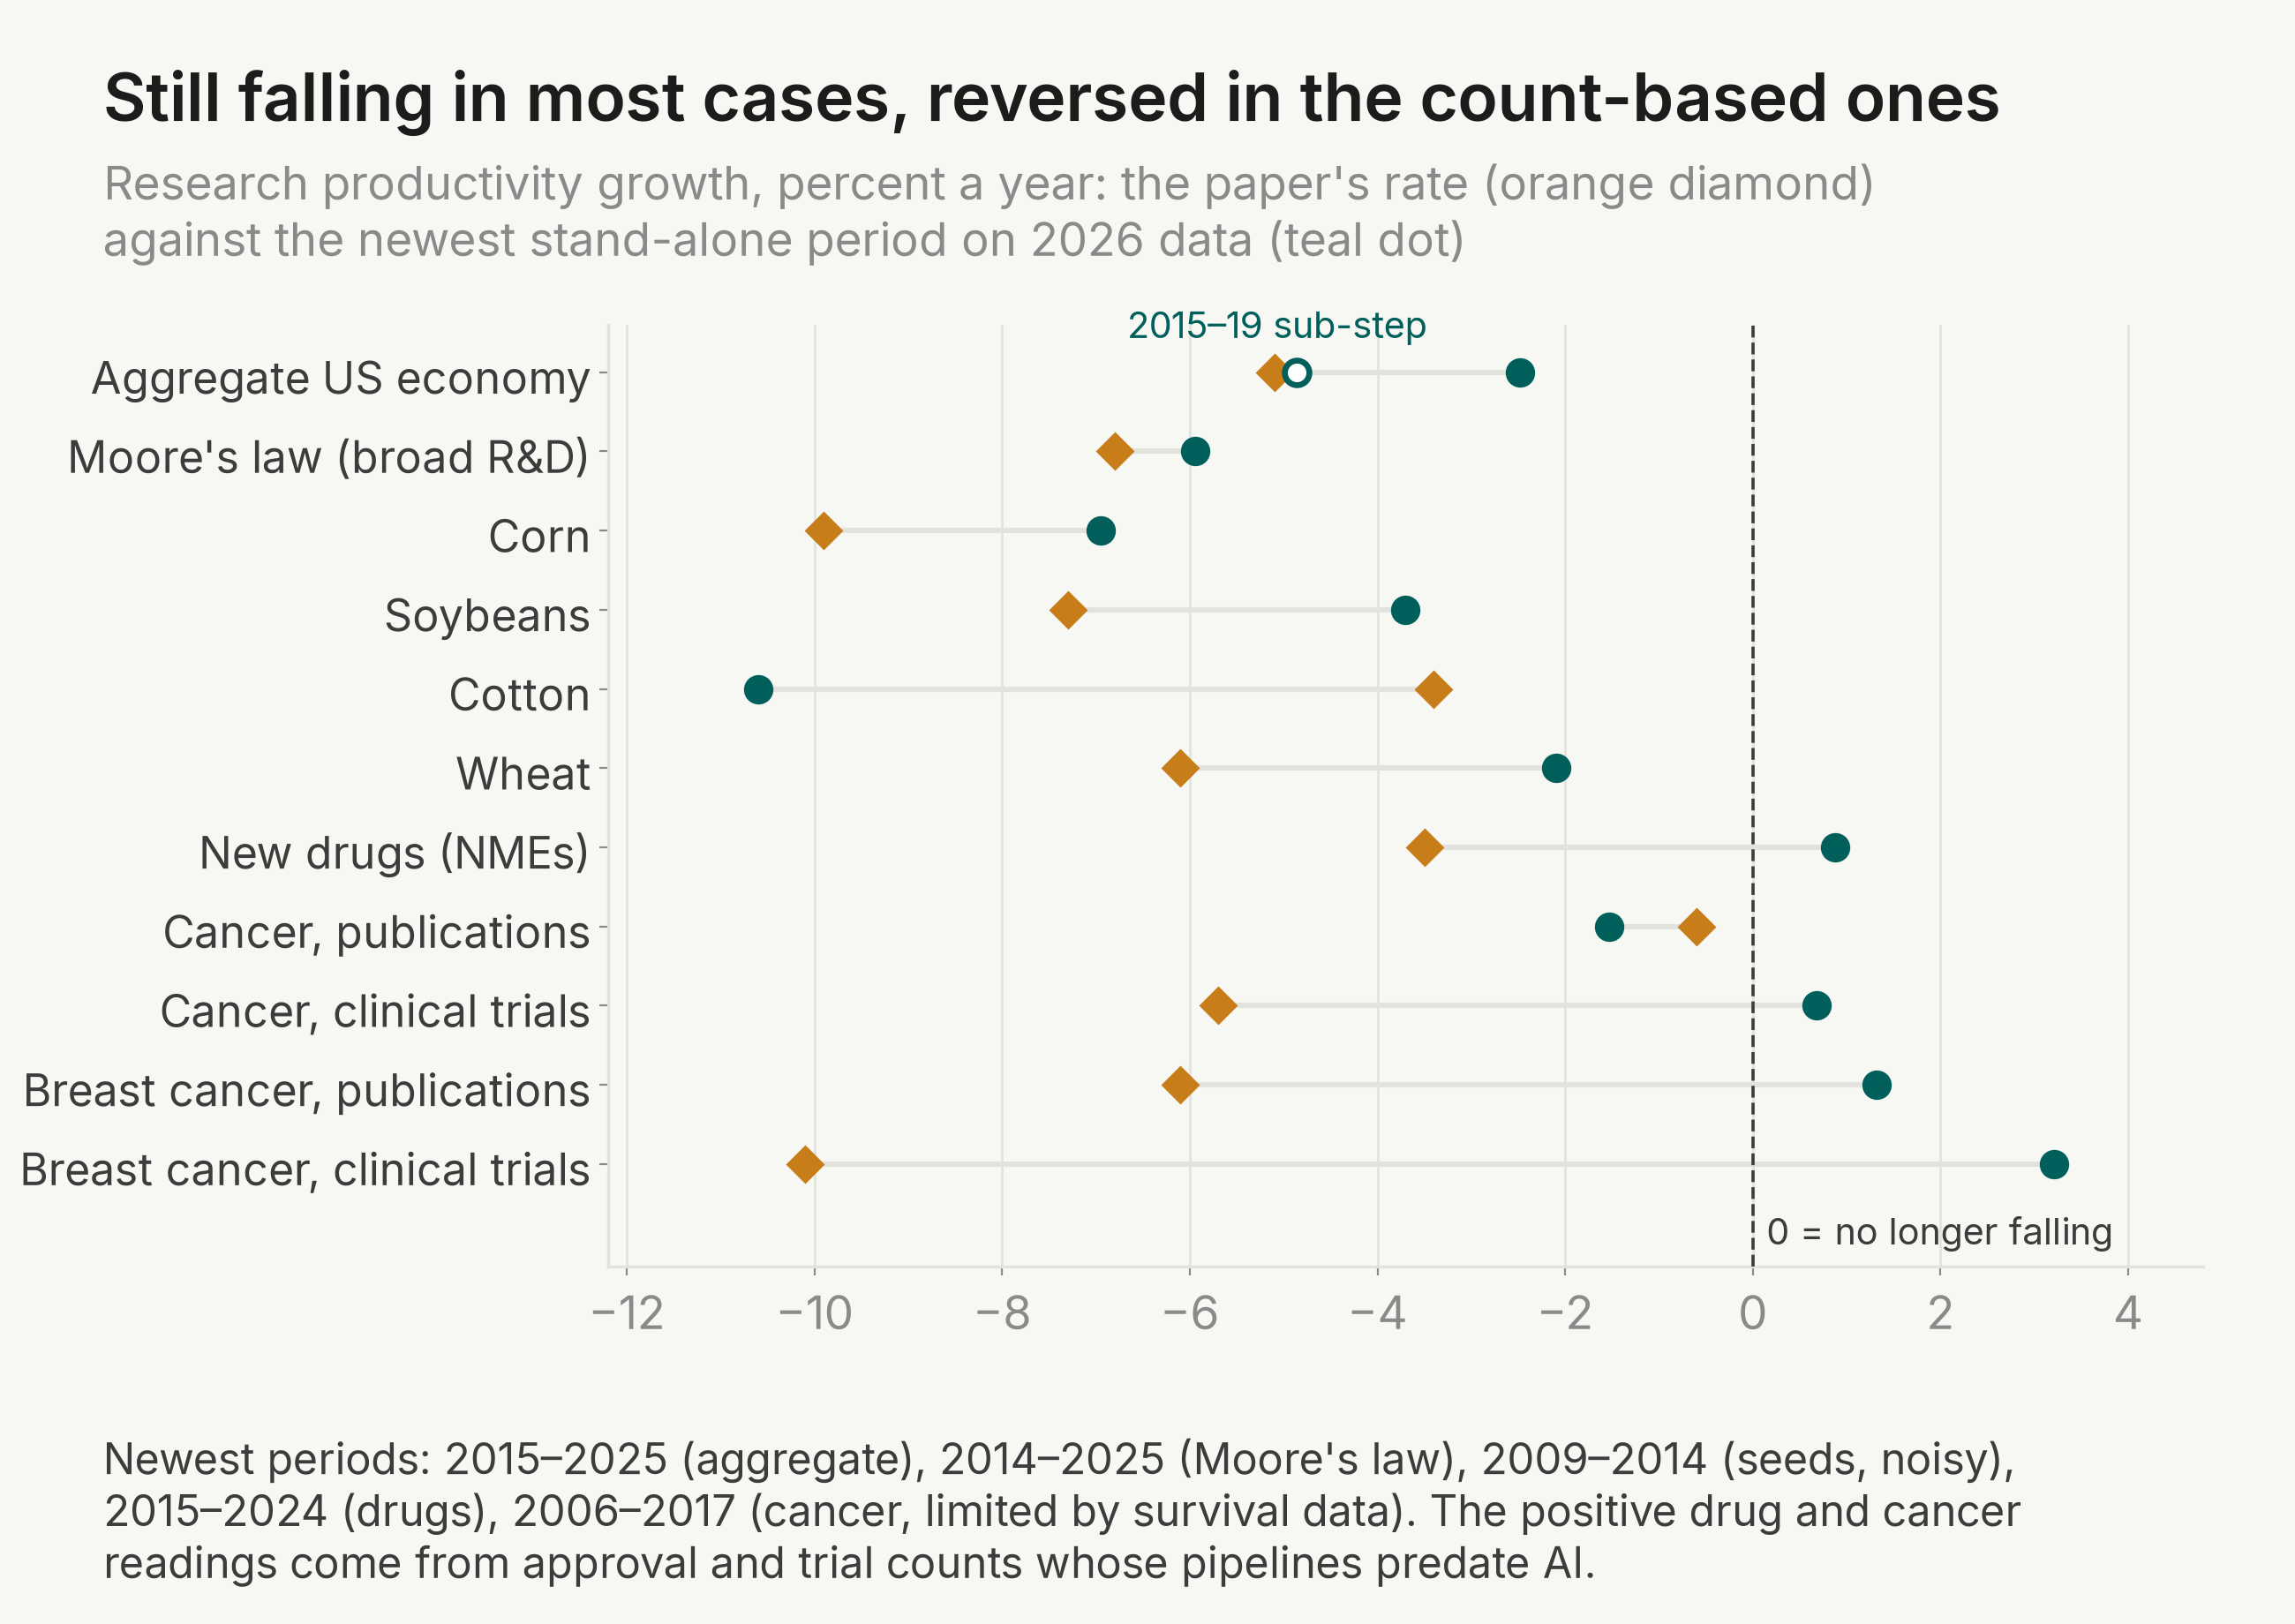
Is research productivity still falling through 2025? Almost everywhere, yes. On the new vintages, the aggregate decline over the paper's own window is essentially unchanged: 4.90 percent a year, against 5.13 on the paper's data. Chaining through to the new 2015–2025 bin, the full decline since the 1930s is 4.5 percent a year, a factor of about 47.
The stand-alone newest decade looks shallower at first. The step from the 2000–2015 bin to the pooled 2015–2025 bin is −2.48 percent a year. But that pooling hides the pandemic. We split the new bin, measuring each sub-step from the same 2000–2015 base. The clean pre-COVID 2015–2019 step is −4.86 percent a year, essentially the historical rate. The 2019–2024 step is −1.21 percent a year from that same base. Between the two sub-bins themselves, measured research productivity actually rose about 5.7 percent a year. This rise is the post-2019 surge in measured TFP, which carries the 2020 pandemic composition shock and the 2021–2024 bounce. Seven robustness variants change the deflator, the output measure and the data vintage. All keep the stand-alone step between −1.0 and −3.1 percent a year, always negative. So through 2025, aggregate research productivity is still falling at close to the paper's rate once the pandemic years are isolated. The early AI years have not visibly bent the aggregate curve.
The case studies mostly agree. The exceptions are the two count-based series, drug approvals and clinical trials, whose recent gains reflect pipelines that predate AI.
| Case | Paper's window on new data | Newest stand-alone period |
|---|---|---|
| Aggregate US economy | −4.90 | −2.48 (2015–2025); −4.86 in 2015–2019 |
| Moore's law (broad R&D) | −6.3 | −5.94 (2014–2025) |
| Corn (seed-efficiency) | −9.43 | −6.95 (2009–2014) |
| Soybeans | −7.01 | −3.7 (2009–2014) |
| Cotton | −3.24 | −10.6 (2009–2014) |
| Wheat | −5.56 | −2.1 (2009–2014) |
| New drugs (NMEs) | −3.57 | +0.88 (2015–2024) |
| Cancer: publications / trials | −0.57 / −5.07 | −1.53 / +0.68 (2006–2017) |
| Breast cancer: publications / trials | −6.77 / −10.05 | +1.32 / +3.21 (2006–2017) |
Notes. All cells are our estimates of research productivity growth in percent a year, from the paper's arithmetic on the data vintages of October 2026. The first column re-runs each case over the paper's own years; the second takes the newest period on its own. The aggregate sub-steps are both measured from the 2000–2015 base. The seed steps rest on R&D data that end in 2014 and are noisy. Semiconductor TFP, agriculture as a whole, heart disease, global agriculture and the firm-level cases could not be extended; the Notes say why.
For Moore's law the paper fixes the output side by assumption: chip density growing 35 percent a year. Measured on today's chips, single-die transistor-count growth was 26.3 percent a year over 2014–2025. Density measures give 19 to 23 percent, and a multi-die upper bound gives 32. Effort kept rising through 2025. With output measured rather than assumed, the newest-era decline is 5.94 percent a year, only slightly shallower than the paper's 6.8. Moore's law itself is slowing, and that does not rescue research productivity in semiconductors.
New drugs are the clearest reversal. Research productivity in NME approvals fell fastest over 1990–2007, at 8.3 percent a year, then recovered as novel approvals surged. The newest era, 2015–2024, is flat to slightly positive: +0.88 percent a year on the within-era trend. The endpoint estimator still gives −1.40, so the sign is not settled. Over the full 1970–2024 window the decline is still 3.21 percent a year. Cancer clinical trials tell a similar story: the paper's window reproduces on new data (−5.07), but the stand-alone 2006–2017 step is +0.68. These diagnosis years predate AI, and the treatments behind them were developed years earlier still. No AI-discovered new molecule had FDA approval as of October 2026.
What would AI have to do
The question is whether AI can produce more growth from the same research effort. The honest answer from this data is a bound, not a verdict, in either direction.
Start with what the aggregate data can detect. Annual US TFP growth, with the R&D add-back the paper uses, has a standard deviation of 1.68 percentage points over 1948–2019. Only 2023 and 2024 are AI-era years in that series. The smallest effect detectable on a two-year mean is about 3.4 percentage points a year; on three years, 2.8. Published estimates of AI's TFP effect in this window run from 0.01 to 1.24 points a year. Every plausible AI effect is therefore below the detection floor, by a factor of 2 to 300. Trend breaks at the paper's decadal resolution are not identifiable before about 2030.
What the two AI-era years allow is a bound. We fitted the paper's research-productivity trend on the bins through 2015–2019 and extrapolated it. The trend predicts mean TFP growth of 0.90 percentage points for 2023–24; the actual add-back value is 2.24. The gap is 1.34 points. But its 95 percent interval, combining trend error and year-to-year noise, runs from −1.1 to +3.8 percentage points a year. The interval contains zero. So the data are consistent with no AI effect at all, and equally consistent with any effect up to about 3.8 points a year. Adding the raw 2025 value lowers the upper bound to 2.9. The 2023–24 years do sit above the extrapolated decline. But that rise is not attributable to AI without further evidence. A July 2026 Federal Reserve note attributes the 2023–2025 gains to the AI capital buildout, which is investment, not research productivity.
How large would an AI effect have to be? To answer, we add an AI multiplier to the paper's idea production function. Let be the stock of ideas, measured by TFP, so its growth rate is idea output. Let be effective research. Let be an AI multiplier, so that is research effort in human-equivalent units. Without AI, . The production function is
Here is the return to research effort. A value below 1 means researchers duplicate each other's work. measures how fast ideas get harder to find: each 1 percent rise in the stock of ideas lowers the output of a given research effort by percent.
Research productivity is idea output divided by effective research, . Write for the growth rate of any variable . Taking growth rates of both sides gives
The three terms are the gain from a growing AI multiplier, the loss from duplication as research effort grows, and the loss from ideas getting harder to find as the idea stock grows.
For the aggregate economy, the newest-era data give . Suppose . Then the duplication term vanishes, and halting the measured decline () requires . So the AI multiplier must grow about 2.5 percentage points a year, sustained indefinitely. Raising steady-state idea growth by 0.25, 0.5 or 1 point a year requires multiplier growth of 0.46, 0.92 or 1.84 points. A one-time jump in the multiplier, even a doubling, buys only a transitory boost. In the model it decays with a half-life of 12 to 19 years. These are model numbers, conditional on , and researcher growth held fixed.
The sectors differ in one theoretically loaded way. Trammell and Korinek (2026, NBER w31815) show that fully automating research sustains or explodes growth exactly when . Moore's law sits in that regime: its newest-era is 0.225, far below 1, because research there grew fastest. The aggregate economy does not, at . So the model treats automation very differently across the paper's own cases, and the aggregate offers no explosive channel.
Does the answer depend on where AI spending sits? AI R&D is already counted as research effort in these series. It was $64.8 billion in 2023: 9.0 percent of US business R&D, and about 3.7 percent of total intellectual-property investment. We recomputed the aggregate step under three definitions of effort: counting AI R&D, excluding it as free augmentation, and using human researcher headcounts. Measured research productivity rose 24 to 26 percent from the 2015–2019 bin to the 2019–2023 bin under all three, and 31 percent when the main definition runs to 2024. Excluding AI R&D moves the step by only about 2 points. At two to three years of resolution, the definitions agree.
One micro case has a dated AI entry, public output and public input: protein structures after AlphaFold. AlphaFold predicts a protein's 3D structure from its amino-acid sequence. Its accurate version was released in 2021. Experimental structures are still determined in the lab, mainly by X-ray crystallography and, increasingly, by cryo-electron microscopy (cryo-EM). Each solved structure is deposited in the Protein Data Bank.
Our idea output is the number of new protein families solved each year. The Protein Data Bank groups proteins whose sequences are at least 30 percent identical into one family. Proteins that close usually share a fold. So a new family is a protein unlike any solved before, not another copy of a known structure. Research effort is NIH structural-biology funding, deflated by the skilled wage as in the paper.
Across all methods, research productivity fell 4.2 percent a year over 2010–2020 and rose 1.4 percent a year over 2021–2024. But the rise does not hold within X-ray, the workhorse method. X-ray research productivity fell 9.9 percent a year before 2021 and 10.8 percent a year after. The all-method flattening comes from cryo-EM, whose share of new families rose from 32 percent in 2018 to 62 percent in 2024. Cryo-EM's rise follows hardware and software advances of the 2010s, so this is a method shift concurrent with AI but independent of it. AlphaFold's 241 million predicted structures are a different object and are not counted as experimental ideas. On this case, AI has not yet raised experimental idea output per researcher in structural biology.
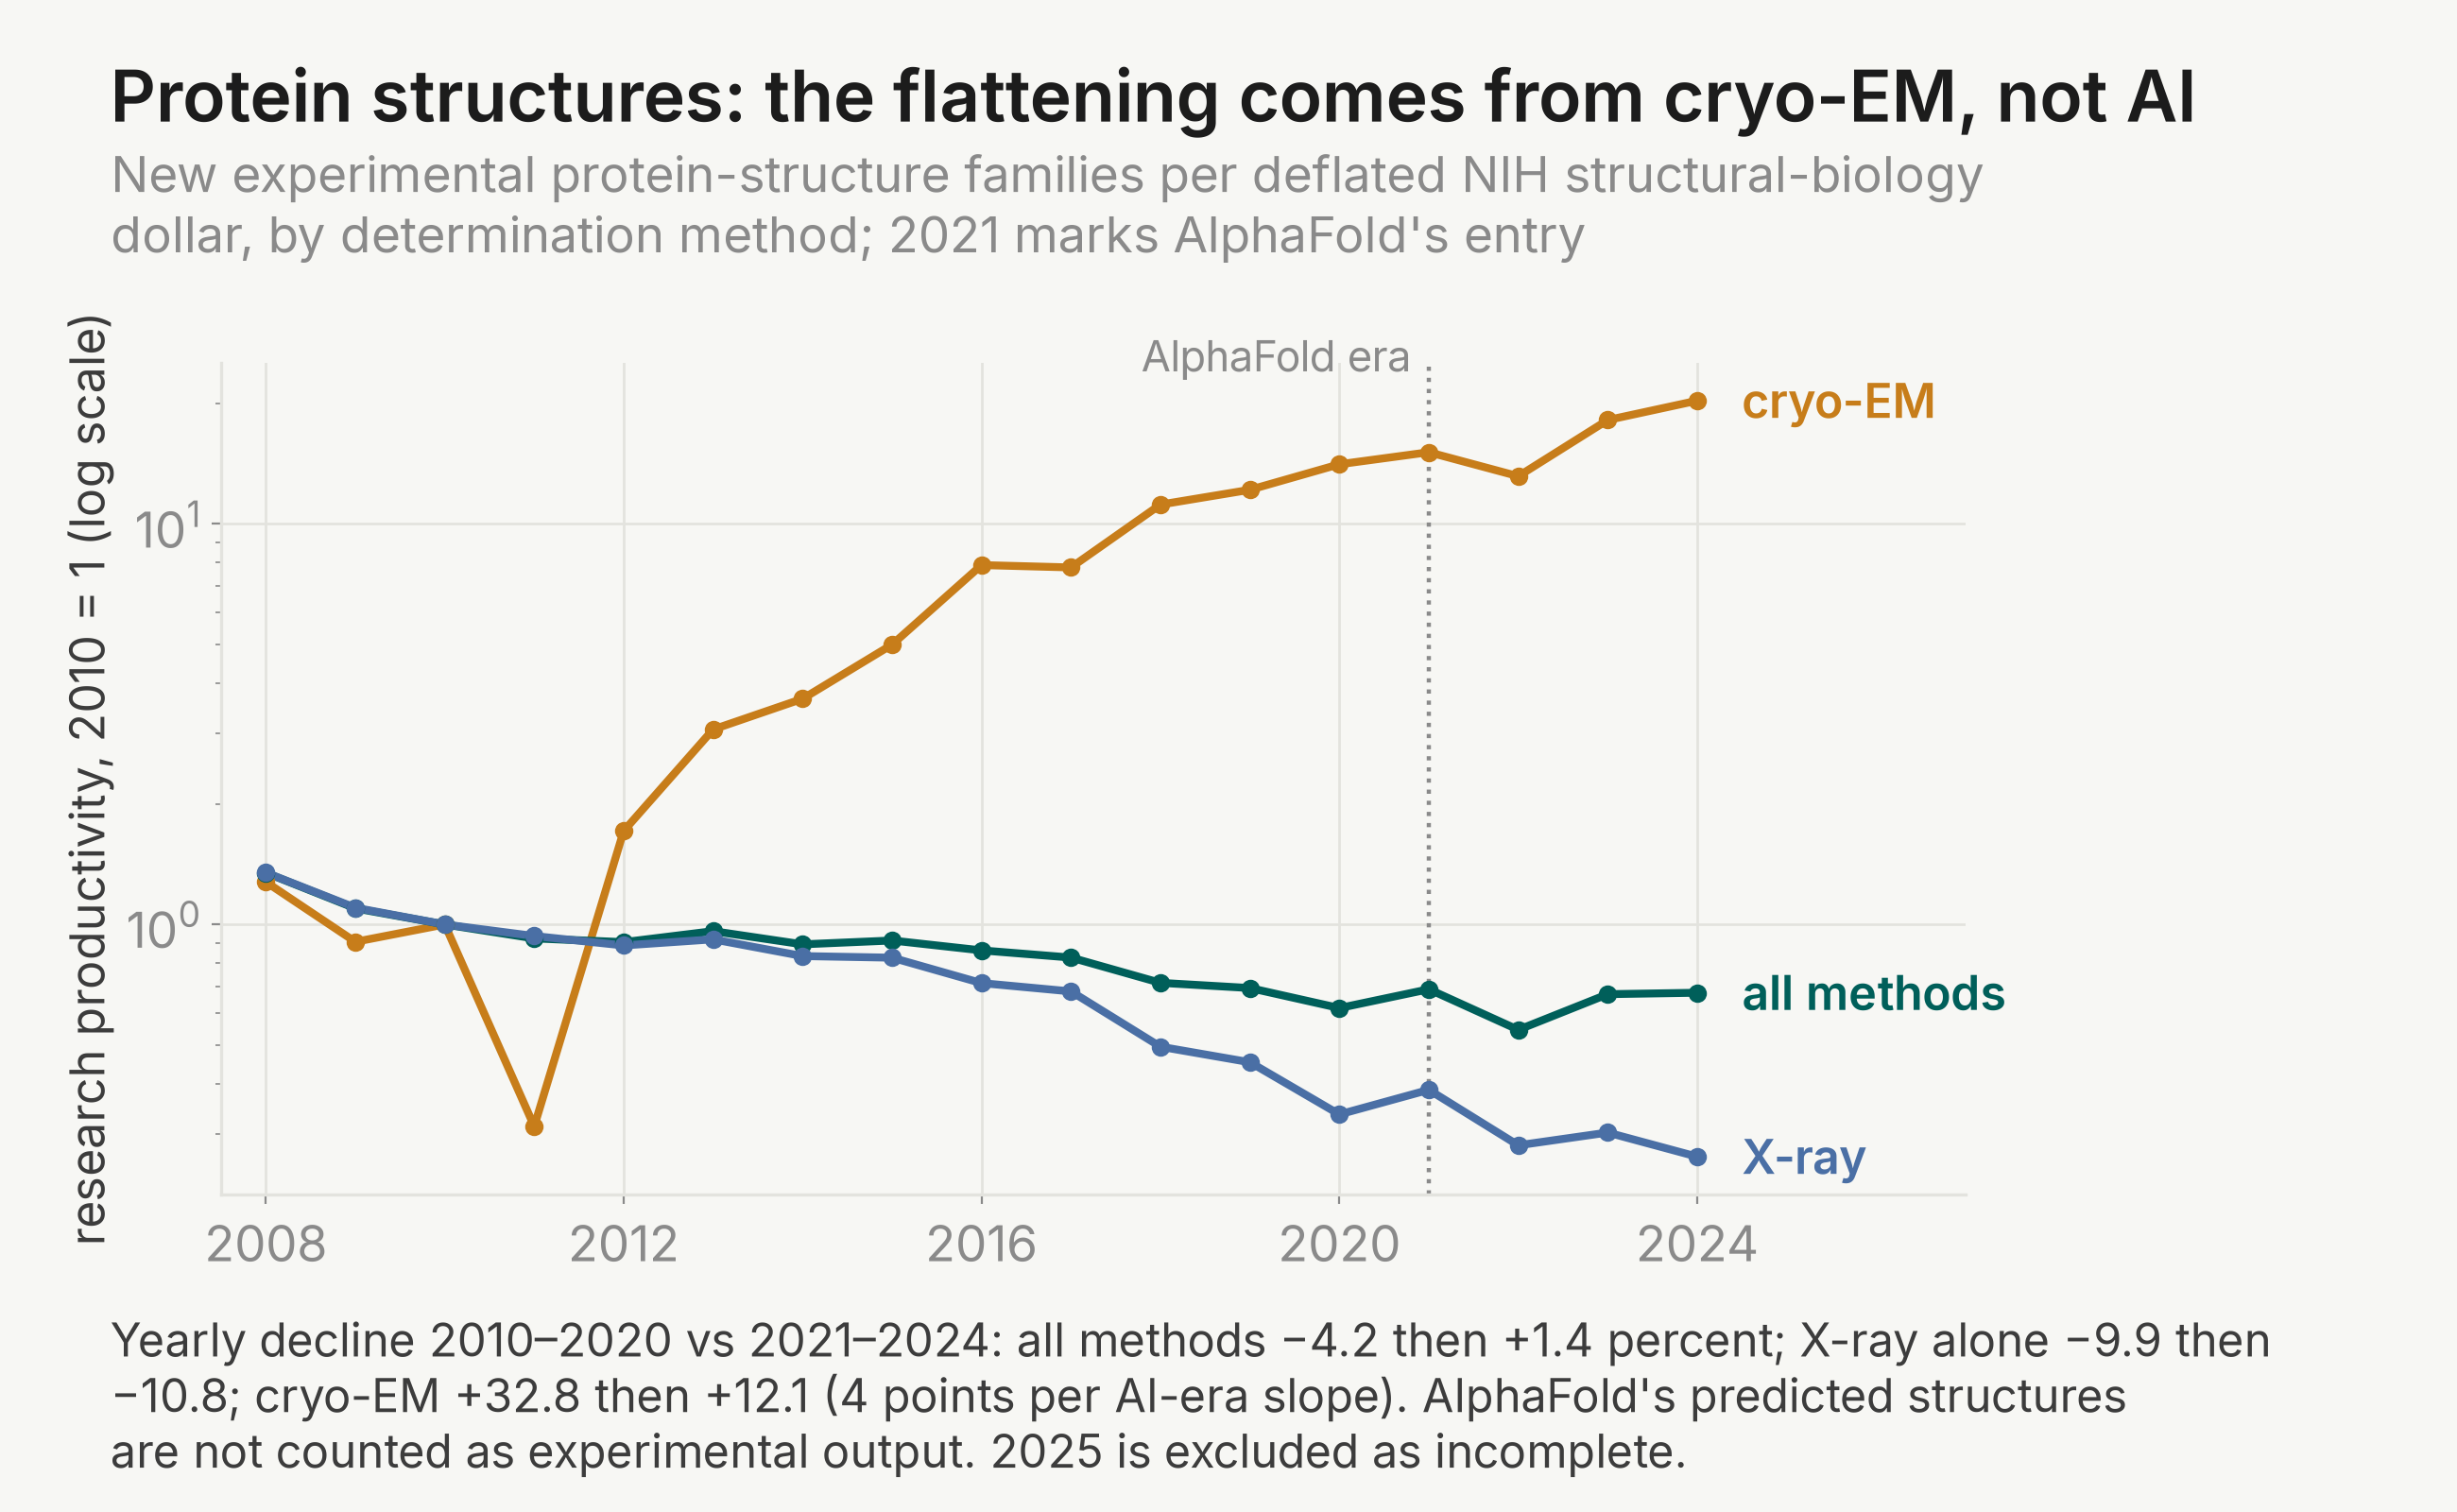
The narrow reading is that the paper's thesis survives its first AI-era test, and the test is weak. Research productivity still falls at close to the original rates wherever the series are clean. The aggregate data cannot detect any AI effect of published size, in either direction, for years. And the one countable AI case so far shows a method shift, not an AI dividend.
How this relates to later research
Fort, Goldschlag, Liang, Schott and Zolas (2025, NBER working paper) argue that growth, not ideas, is getting harder to find. The patent yield of R&D rose, so they place the wedge between ideas and growth. Ando, Bessen and Wang (2025, working paper) point to rising obsolescence of existing ideas. Both offer mechanisms the paper's aggregate ratio cannot distinguish from harder ideas. A falling measured research productivity is equally consistent with harder ideas, a widening ideas-to-growth wedge, or faster obsolescence. The firm-level data that could separate them are exactly the licensed Compustat and Census layer we could not test.
Hill and Stein (2026, NBER working paper) study AlphaFold directly and reach the same conclusion: experimental structure output has not changed since 2021. AlphaFold instead helps researchers solve structures, and it has shifted downstream research toward proteins with no prior structure. Our case adds the per-dollar measure the paper uses, and shows that the all-method rise after 2021 is a cryo-EM effect, not an AI one.
Aghion, Jones and Jones (2019, NBER working paper) supply the automation framing our multiplier borrows, and Trammell and Korinek (2026, NBER working paper) the explosive-growth condition. Two authors in this AI-theory literature carry a disclosure we repeat here. Charles Jones, also an author of the original paper, has been on leave at Anthropic since June 2026. Anton Korinek holds an Anthropic Institute role. On the measurement side, Acemoglu (2024, NBER working paper) projects an AI TFP effect near 0.07 points a year. A 2025 randomized trial by METR found that early-2025 AI tools slowed experienced developers. Both results sit inside our bound, which is the point: the aggregate data cannot yet referee this literature.
Notes
These are the judgment calls and data limits behind our numbers, so you can decide how much weight each result deserves.
- The aggregate idea output is BLS private-business TFP growth with the contributions of R&D and other intellectual-property investment added back, as in the paper's code. The "add-back" above refers to this.
- No rate on this page has a standard error attached unless stated. The paper's rates are endpoint ratios. Ours are endpoint ratios or within-era trend fits on annual data. The protein-structure era contrast is the one place we computed one. The all-method change of +5.6 points a year has a standard error of 5.9.
- The −1.21 percent a year quoted for 2019–2024 is measured from the 2000–2015 base, like the −4.86 for 2015–2019. Taken sequentially, measured research productivity rose about 5.7 percent a year from the 2015–2019 bin to the 2019–2024 bin. We read that rise as the pandemic and AI-buildout surge in measured TFP, not as a resumed rise in research productivity. The 2015–2019 sub-bin is the cleaner signal.
- The new 2015–2025 bin carries two known distortions. One is the 2020 pandemic composition shock. The other is a BLS re-vintaging that moved about 0.2 points of TFP growth from the 1990s into 2000–2014. The re-vintaging alone moves the stand-alone step by about 1.5 points. It is one of the seven robustness variants.
- Semiconductor TFP (the paper's Table 1 bottom panel) shipped no code. We rebuilt it from its named sources and matched the two rows that are testable to within 0.5 points a year. The other two rows need a licensed patent-weighted R&D split. So the rebuild is only partly anchored, and we do not headline its extension. The unanchored series shows industry TFP growth falling from about 20 percent a year in 1990–2005 to about 4.5 percent in 2005–2016, while effort kept rising.
- Agriculture as a whole also shipped no code. Our rebuild matches the paper's US row to within 0.5 points (−3.23 against −3.7). Past 2014 the USDA publishes no private agricultural R&D total, so an extension can only use public R&D. That makes measured effort fall by construction. The resulting positive newest-era number is an artifact of the missing series, not evidence that agricultural research productivity is rising. We report no newest-era value for this case.
- Heart disease could not be extended; the recent mortality table it needs sits behind a click-through. Neither could global agriculture, nor the firm-level Compustat and Census cases (licensed and restricted data). The Moore's-law patent weights are the authors' 2014 weights, because the underlying patent database is licensed.
- The seed-yield extension's newest step is 2009–2014, because the private crop R&D series ends in 2014. With five years and four crops it is noisy. The 2015–2025 yield data enter only the longer windows.
- The NME newest-era sign depends on the estimator. We pre-declared three: within-era trend (+0.88), three-year endpoint average (+0.76) and raw endpoint (−1.40). The disagreement is reported, not resolved.
- Cancer years of life saved use five-year survival, which ends at diagnosis year 2018, so the cancer cases stop at 2017. Publications, the less lagged effort measure, still show a decline for all cancers (−1.53).
- The X-ray protein series counts every new family first solved by a method other than cryo-EM. These are mostly X-ray structures, with a small NMR share.
- The protein-structure AI-era slopes rest on 4 annual points each, so we draw only consistent-with readings. Under the depositor-headcount effort measure instead of NIH dollars, the all-method AI-era slope stays negative (−2.2 percent a year). This strengthens the method-shift reading. 2025 is excluded because recently deposited structures are still being released.
- The two alternative effort definitions (AI R&D excluded, and researcher headcounts) end in 2023 with their source surveys. The main definition reaches 2024. Steps are compared on matched endpoints, so the AI-removal effect is not an endpoint effect.
- The required-multiplier and level-effect numbers are model calculations, conditional on the estimated , on , and on researcher growth staying at its newest-era value. They are not forecasts.
- Our Python port reproduced every anchor value in the authors' output logs before any new data entered, including the lower-duplication appendix case. Both studies' computations re-run to the same values from the archived code and data.
Data sources for the extension studies
The extension studies pulled fresh public data on October 14, 2026. In full:
- US Bureau of Labor Statistics, total factor productivity for major sectors, historical SIC-NAICS-linked tables: private business TFP 1948–2025 with the R&D and intellectual-property contribution rows 1987–2024, release of March 19, 2026, from bls.gov/productivity/tables. Also the detailed-industry TFP table for NAICS 3344 (semiconductors), 1987–2023, released September 24, 2026.
- US Bureau of Economic Analysis via FRED: private and government intellectual-property-products investment, R&D, GDP and population (series Y001RC1A027NBEA, Y055RC1A027NBEA, Y694RC1A027NBEA, GDPA, B230RC0A052NBEA), 1929–2025, NIPA vintage of September 30, 2026; and NIPA Table 5.6.5 private R&D (Y006RC) for the survey-to-NIPA conversion.
- US Census Bureau, CPS ASEC historical income table P-18: mean income of men 25 and over with a bachelor's degree or more, 1991–2025, updated September 15, 2026. This is the skilled-wage deflator in every case.
- SEC EDGAR: XBRL company facts for 51 semiconductor filers plus TSMC and ASML 20-F filings, fiscal years 2006–2025, converted at FRED annual exchange rates; used to extend the Moore's-law R&D series.
- Measured Moore's-law output: Wikipedia "Transistor count" (revision of September 14, 2026), the Epoch AI ML hardware dataset (CC-BY 4.0), Karl Rupp's microprocessor trend data, and Our World in Data's transistors-per-microprocessor series.
- NBER-CES Manufacturing Industry Database, vintage 5818v1 (1958–2018), NAICS 334413 TFP, for the semiconductor-TFP rebuild.
- USDA National Agricultural Statistics Service Quick Stats: national yields for corn, soybeans, cotton and wheat, 1960–2025.
- USDA Economic Research Service: agricultural and food R&D expenditures (public series to 2021–2022; the private total ends in 2014) and US agricultural TFP 1948–2023 (page of June 2, 2026).
- US FDA, Center for Drug Evaluation and Research: compilation of NME and new-biologic approvals 1985–2025, plus the novel-drug-approvals pages for 2025 and 2026.
- PhRMA 2025 Annual Membership Survey, Table 1: member R&D expenditure 1987–2024.
- NCBI PubMed E-utilities: publication and clinical-trial counts by year under the paper's exact MeSH queries for neoplasms, breast neoplasms and heart diseases, 1960–2025.
- NCI SEER*Explorer: five-year relative survival by diagnosis year through 2018 and US cancer mortality through 2024.
- CDC National Center for Health Statistics: annual US life tables 2010–2024, replacing the Human Mortality Database past 2013.
- NCSES (National Science Foundation), Business Enterprise R&D survey tables: AI R&D and total business R&D, 2020–2023 (2023 release of September 29, 2025).
- OECD Main Science and Technology Indicators, March 2026 edition: US total researchers in full-time equivalents, to 2023.
- RCSB Protein Data Bank: the 30-percent-sequence-identity cluster file (of October 11, 2026) and search-API facets, for new experimental structure families and distinct depositors by year.
- CASP / UC Davis Prediction Center: best GDT_TS scores by assessment round, CASP1 through CASP16 (1994–2024).
- NIH RePORTER API: structural-biology award dollars by fiscal year, 2008–2025.
- Bloom, Jones, Van Reenen and Webb (2020), American Economic Review 110(4): 1104–1144, data and code (openICPSR 111743): the MATLAB modules and embedded data,
WageScientistData.matandSeed data v6.xlsx, reused for every paper-side series and anchor.
Every fetch was keyless; licensed and restricted sources (Compustat/WRDS, the Census research data centers, PATSTAT, the Human Mortality Database behind its login) were not used, and their absence is handled by the named splices and scope limits above. The AI theory study fetched no new data beyond the staged series and literature listed here; it works from the first study's estimates.
The full working directory for this paper, with the replication and extension code and outputs, is public at github.com/living-sciences/living-ideas.
Cite this report
@misc{econ:ideas,
  title        = {Are Ideas Getting Harder to Find? Bloom, Jones, Van Reenen and Webb (2020), replicated and extended to 2026},
  year         = {2026},
  howpublished = {Living Science},
  url          = {https://livingscience.ai/econ/living-ideas},
  note         = {Replication repository: https://github.com/living-sciences/living-ideas},
}
Discussion
Sign in to join the discussion.
Loading discussion…