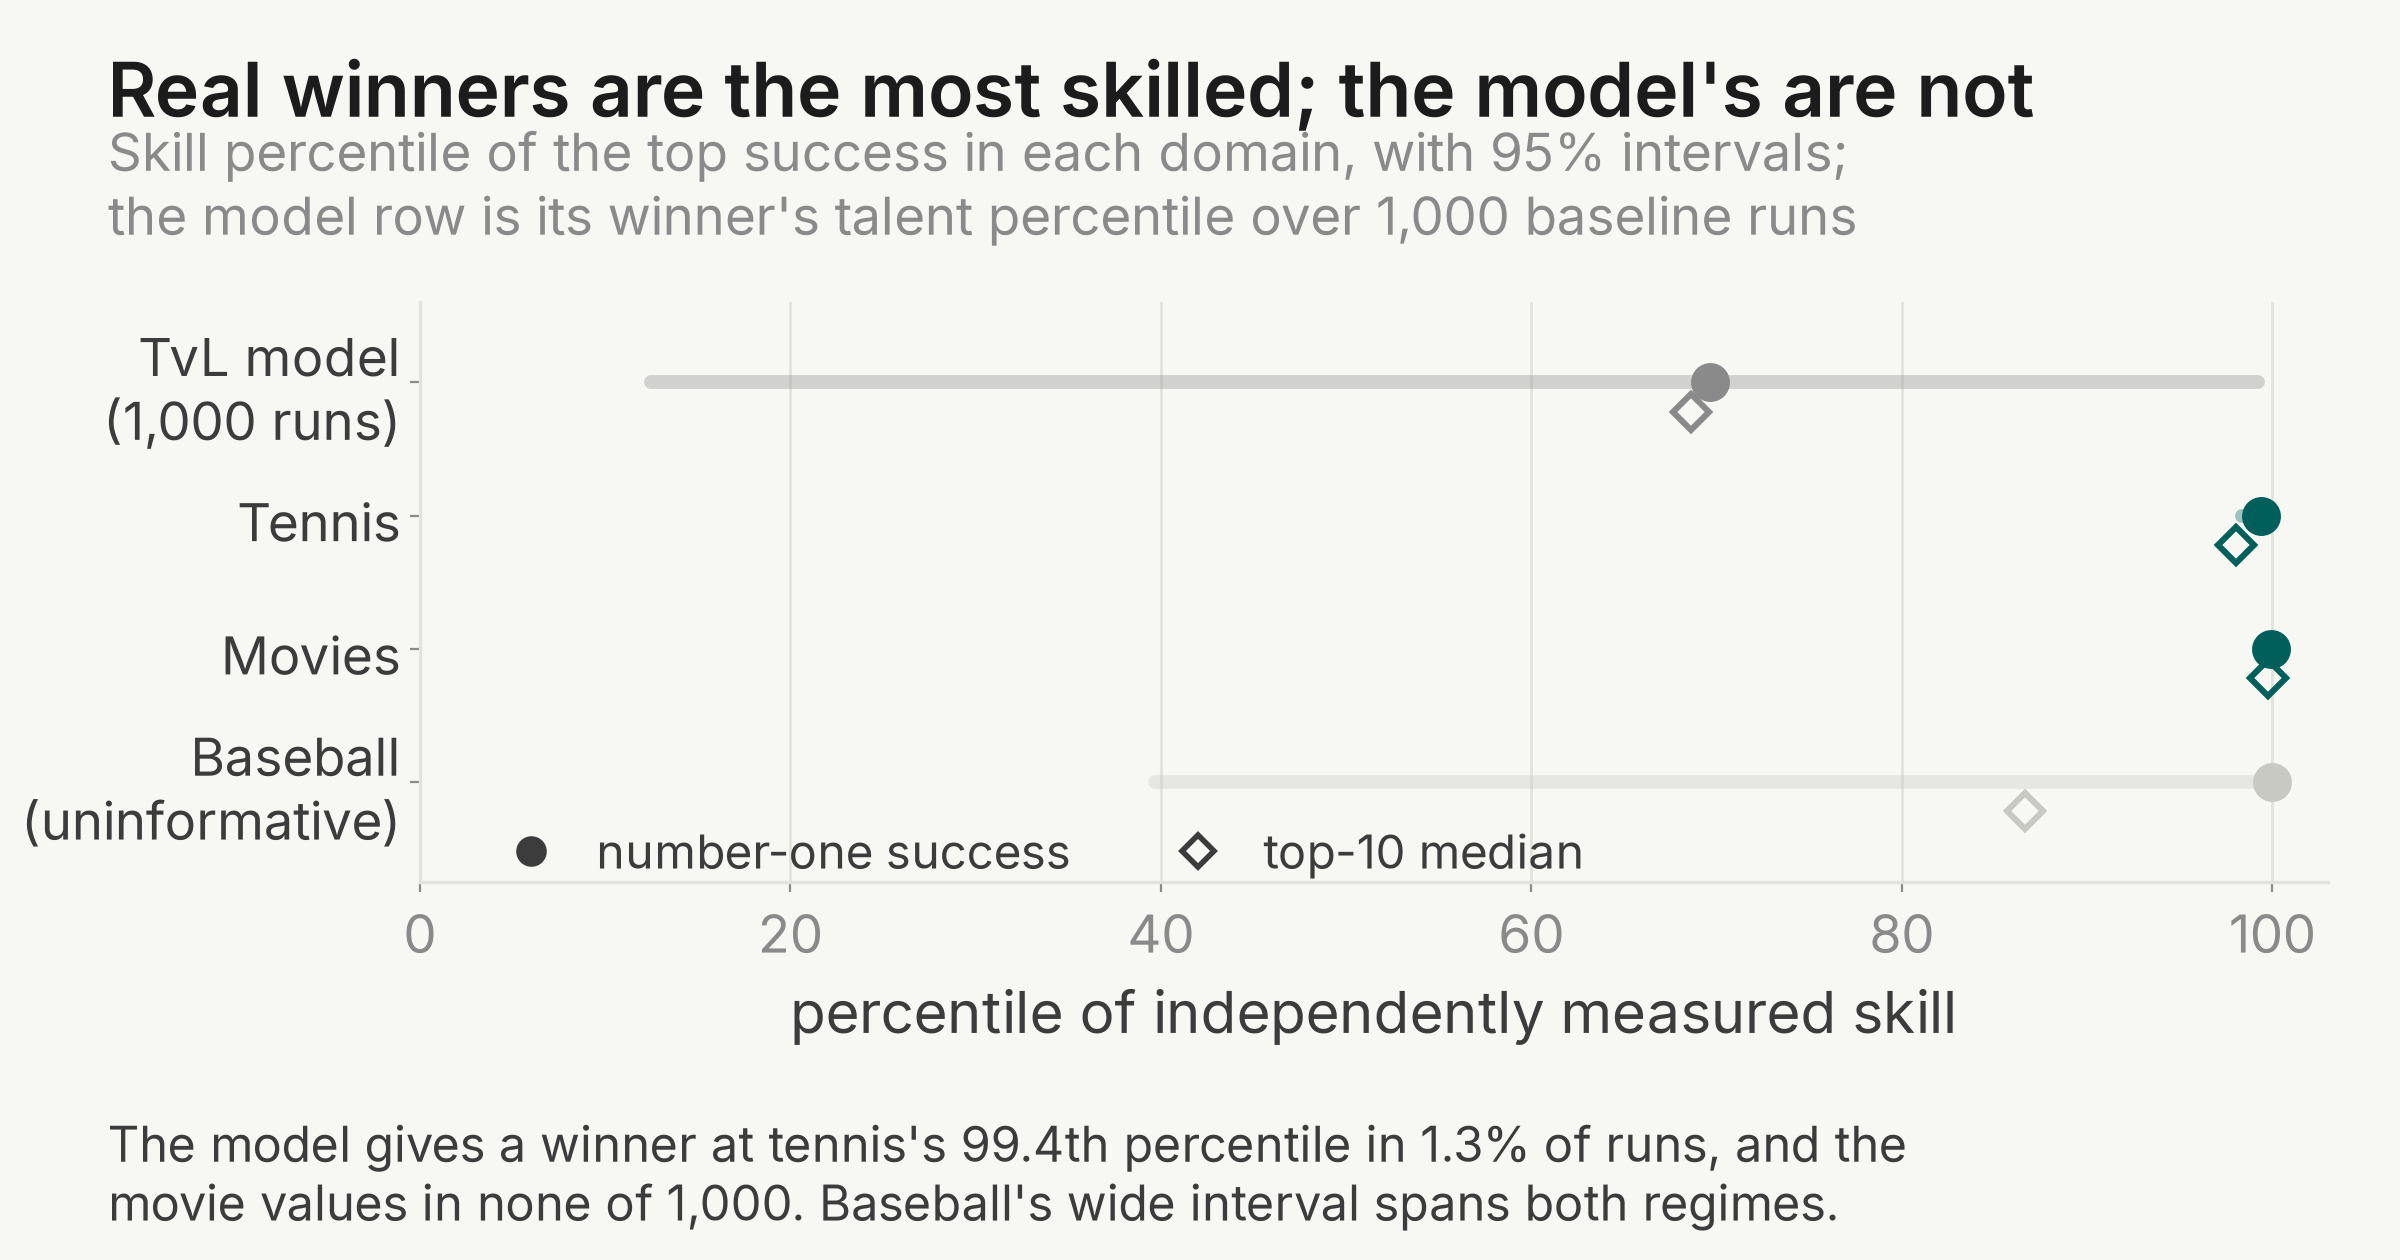
Talent is roughly normally distributed, but wealth and success follow fat-tailed distributions. Pluchino, Biondo and Rapisarda ask whether randomness alone can explain the gap. Their Talent vs Luck model follows 1,000 agents with fixed Gaussian talent through 40 years of randomly moving events. A lucky event doubles an agent's capital with probability equal to talent; an unlucky event halves it regardless. The model turns Gaussian talent into a Pareto-like capital distribution, and its winners' talent averages 0.667 against a population mean of 0.6. So the paper concludes that the most talented almost never reach the top, and that equal or random research funding beats funding by past success. Our extension tests the model's findings against real-world data in sports, entertainment and poker: the fat tail appears in every domain we measured, but the signature prediction fails in tennis and movies, where we could pair success with a skill proxy (the all-time tennis titles leader sits at the 99.4th percentile of points won and the most-voted film at the 99.9th, against the model's roughly 70th), while the funding conclusion survives every variant of the model we fitted.
The paper's main claims
- Final capital is fat-tailed and Pareto-like. In the illustrated run, the richest 20 percent of agents hold 80 percent of the capital. Pooled over 100 runs, capital follows a power law with slope about .
- The most successful are rarely the most talented. Over 10,000 runs, the best performer's talent is Gaussian with mean 0.667 and standard deviation 0.09. By the paper's text, agents with talent above 0.8 win only 3 percent of runs.
- Egalitarian funding beats elitarian funding. Across the paper's menu of funding strategies, an equal unit to every agent is the most efficient at raising , the share of talented agents who end above their starting capital. Random funding is about four times as efficient as concentrating the same budget on the already successful.
- A stimulating environment amplifies talent. Raising the share of lucky events to 80 percent roughly doubles to 62.18 percent. Lowering it to 20 percent collapses to 8.75 percent.
The model is a simulation with hand-set parameters, so the paper reports no standard errors. Its only stated uncertainty is that varies by less than 2 percent from run to run.
What we were able to do
The authors released one file: TvLmodel.nlogo, a NetLogo demo. It runs a single simulation on screen and exports no data. We ran it headless under NetLogo 6.4.0, adding per-step logging and a fixed seed; no model rule was changed. Nothing behind the multiple-run, funding or environment results (sections 2.2 to 3.2) was released.
So we rebuilt those experiments from the paper's text, in Python (reimpl/tvl.py and its drivers). The rebuild mirrors the NetLogo rules: a toroidal world, fixed agent positions, randomly walking events, one event per agent per step. Its event dynamics match the demo closely (mean lucky events 1.49 against the demo's 1.61; event-free share 0.174 against 0.164). We then re-ran the 100-run and 10,000-run experiments, every funding strategy in both budget designs, and the four environment variants.
For the extension, we paired a skill proxy, measured separately from success, with a success measure in each real domain. Tennis uses career share of points won against career titles (ATP data, 1991–2025, 334 players). Movies use IMDb average rating against vote counts (49,346 films with at least 1,000 votes). Baseball uses Statcast exit velocity against All-Star selections and awards, with salaries for concentration. Chess (FIDE ratings, 2015–2026) serves as a skill-dominated control. Poker (57 World Series Main Events, 1970–2026) covers the luck end, and science citations enter for concentration only. The model side of every comparison is 1,000 fresh runs of the rebuilt engine at the paper's baseline parameters.
What we got when we re-ran it
Everything the paper argues reproduces. The 10,000-run best-performer talent came out Gaussian with mean 0.670 and standard deviation 0.093, against the printed 0.667 and 0.09. The demo's single run respects the 80-20 rule. Without funding, 31.7 percent of talented agents end above their starting capital, against the paper's 32.05. Egalitarian and random strategies fill the top of both funding tables, and every elitarian strategy sits at the bottom. At a 10,000-unit budget, random funding is 4.1 times as efficient as elitarian in our table; the paper has about 4.0. An 80 percent lucky environment roughly doubles , and a 20 percent one collapses it. No result of the paper fails to reproduce.
The exact printed numbers behind sections 3.1 and 3.2 are another matter. They are the most interesting thing the re-run found. In the funding tables, our egalitarian and random values run 2 to 5 points above the printed ones. Every elitarian row lands within half a point. The environment values are off in both directions. We get 35.0 and 34.0 percent where the paper prints 38 and 37.5, then 59.1 against 62.18, and 9.7 against 8.75. These gaps exceed the paper's own stated 2 percent run-to-run stability. For the environment values, they are about seven batch standard deviations of the rebuilt model. So the offsets are systematic, not sampling noise. The released demo pins down every model rule, and our rebuild matches that demo. The natural reading: the unreleased code behind these tables differed from the authors' released demo in some detail.
A second finding points the same way. The paper states twice that talent is truncated to the interval . The released demo draws talent unclipped. And the paper's own results need the unclipped version. Its Figure 13 reports the average capital of the most talented agents, defined as talent above . In the widened-talent panel that cut equals 1.0. Under the stated truncation the set is empty, yet the paper reports a value of about 319. The written specification contradicts the reported results; only the unclipped rule reproduces them.
Two smaller defects are arithmetic. In the Figure 10 table, the row "25% BEST 10u, OTHERS 5u" prints a total budget of 70,000. The row's own allocation rule totals 50,000 over 8 injections. With the correct budget, its efficiency rises from 0.21 to about 0.27. The second is the printed 3 percent for how often agents with talent above 0.8 win. The released rules produce about 8 percent: our 100-run batches average 8, and a 1,000-run reference gives 7.8. Note that only 2.3 percent of agents have talent above 0.8. So even at the printed 3 percent, high-talent agents would win more than their population share.
The power-law exponents also came out shallower than printed: pooled over 100 runs, against . The exponent depends heavily on the fitted range, which the paper does not state. The Notes carry the detail. The appendix tabulates every quantity, ours beside the paper's.
The fat tail appears everywhere, and says little
We tested the model's observable signatures against real-world data in sports, entertainment and poker, using the newest open data as of October 2026.
The first signature holds everywhere: success is fat-tailed while measured skill is near-symmetric and compressed. The top 20 percent of tennis players by titles hold 63.9 percent of all titles. For films by votes, the top 20 percent hold 88.3 percent. For 2015 science papers, the top 20 percent hold 92.8 percent of citations. For baseball careers, the top 20 percent hold 63.7 percent of salary. Meanwhile the skill measures are nearly Gaussian. Career point share in tennis has skew 0.75; film ratings have excess kurtosis 0.92.
This is the paper's starting observation, confirmed. But it is weak evidence. Any multiplicative process turns compressed inputs into fat-tailed outputs, whatever the role of talent. The signature could only have told against the model by being absent.
In tennis and movies, the most successful rank near the top of the skill proxy
The model's sharp prediction is decoupling at the top. Its winners are mediocre. In 1,000 baseline runs, the best performer sits on average at the 69.6th percentile of talent. It reaches the top talent decile in 26.9 percent of runs. The paper's own fitted curve implies the 74.9th percentile. If real careers worked this way, the most successful people would rarely rank near the top on a measure of skill.
In tennis and movies they do. The all-time ATP titles leader sits at the 99.4th percentile of career point share (95 percent interval 98.4 to 100). The top ten by titles have a median skill percentile of 98.1. Excluding final-match points from the skill measure, to limit circularity, changes nothing (still 99.4). By Grand Slam titles, the leader is at the 100th percentile. Movies are even sharper. The most-voted film sits at the 99.9th percentile of rating, and the ten most-voted at a median 99.7.
These are proxies, not talent. Career point share is performance in the same matches that produce titles, so it carries some of the same luck; excluding finals limits this but does not remove it. An IMDb rating is audience reception of a film, not the skill of the people who made it. What the data show is that the most successful rank near the top of these proxies, which the model's winners do not. They do not show that the most successful are the most talented.
The model essentially never produces this. A winner at or above tennis's 99.4th percentile appears in 1.3 percent of its baseline runs. A top-ten median at or above 98.1 appeared in none of 1,000 runs; the movie values were also never exceeded. Both domains meet both of our pre-declared contradiction conditions (winner and top-ten median above the 95th percentile). Tennis and movies sit in the model's talent-dominated corner, which its baseline parameters rule out.
Baseball is uninformative. The hardest hitter of the Statcast era is also the success leader, but the panel is small (431 players). The winner's skill percentile therefore carries an interval of 40 to 100, spanning the model band and the skill-dominated band alike. The minimum detectable effect is about 0.33 skill-percentile points, larger than the gap the test would need to resolve. Chess cannot enter this test at all: Elo is both the skill and the success ranking.
Rank persistence separates the domains, but the model cannot produce it
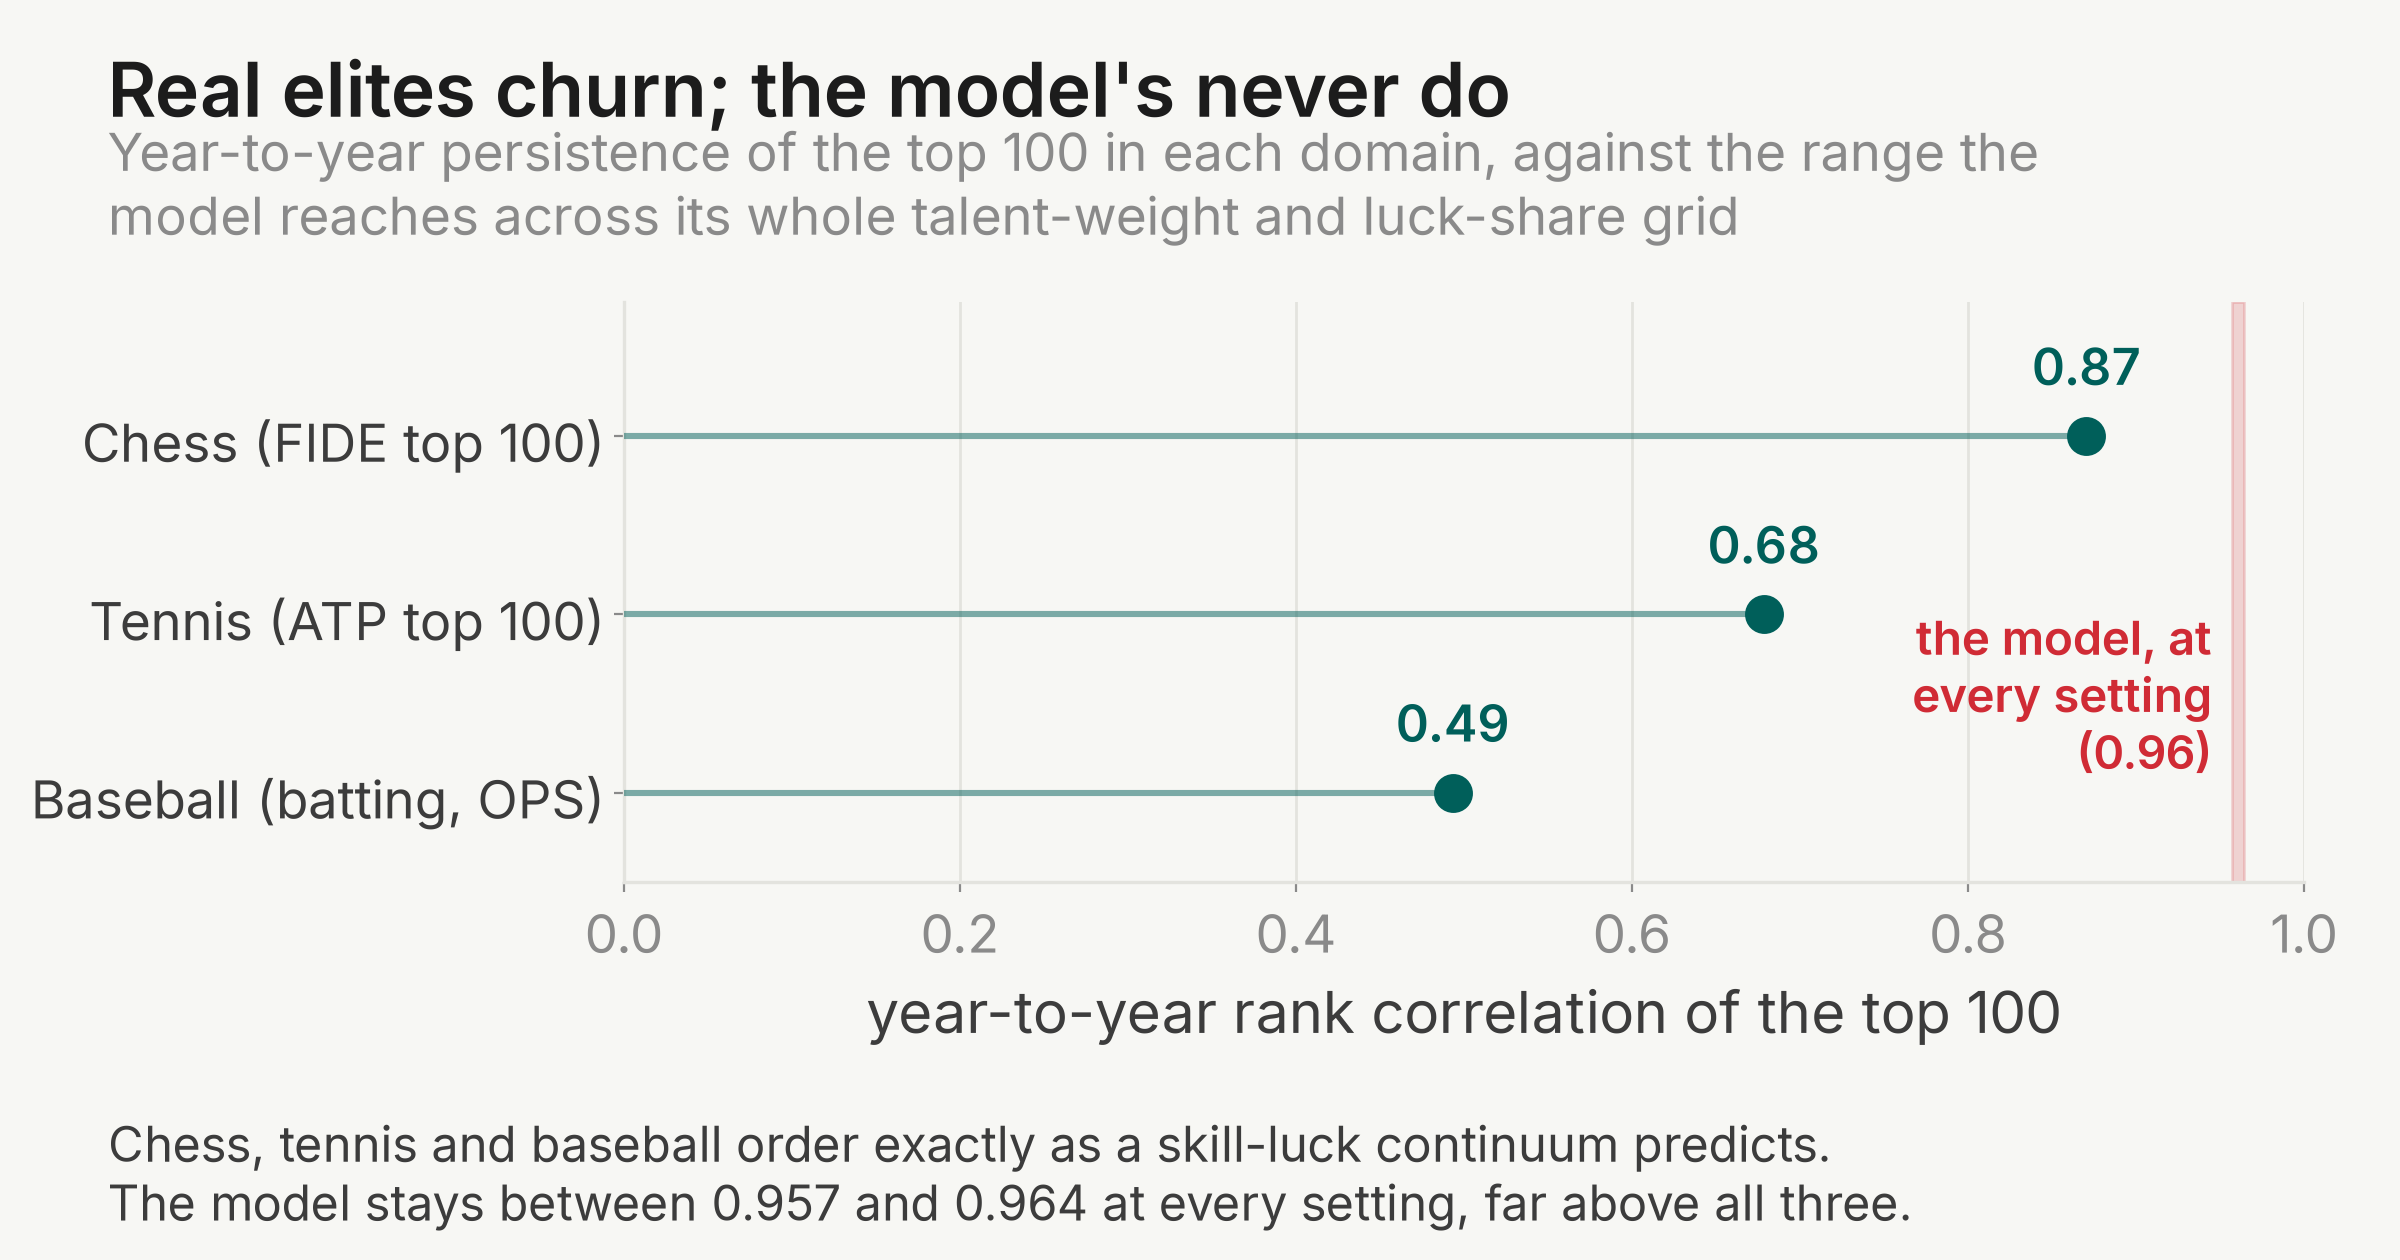
Elite ranks should churn more in luckier domains. They do. Year-to-year rank correlation among the top 100 is 0.870 in chess, 0.678 in tennis, and 0.493 for baseball batting (OPS). That is the ordering a skill-luck continuum predicts, with the fewest-trials sport churning most.
The model cannot reproduce any rung of this ladder, let alone its order. Its year-to-year top-100 persistence is 0.959 at baseline. Across every parameter setting we swept, it stays between 0.957 and 0.964. Capital ranks in the model are far stickier than any real elite we measured. And the ladder does not rescue the decoupling prediction. The number-one performer sits at the 99th skill percentile or above in every measured domain, high-churn or low.
Poker, where luck should dominate, cannot decide the question with public data. No one won two Main Events over 1990–2025. A no-skill world expects 0.31 repeat champions over that window. A strong-skill world (a 5-fold edge for a skilled tenth of the field) expects 1.12. With modern fields of 8,000 to 10,000 entrants, zero repeats is what both worlds predict. We therefore declared this test uninformative in advance and report poker descriptively. The best returns-based evidence is Levitt and Miles (2014, Journal of Sports Economics). At the 2010 World Series, a priori skilled players earned a 30.5 percent return, against minus 15.6 for others. Skill is detectable in poker returns; its weight is not measurable from champion lists.
No setting of the model reproduces any domain
Maybe the baseline parameters are just wrong, and some other setting fits. To test this, we gave the model a talent-leverage dial . A lucky event now doubles capital with probability , so is exactly the paper's rule and is pure luck. We swept 11 values of against 5 values of the lucky-event share , 100 runs per cell. The question: does any cell jointly reproduce a domain's concentration, winner-skill percentile and persistence within three standard errors?
None does, in any of the four fitted domains. Two gaps are structural, surviving the entire grid:
- Winners are too mediocre. The model's winner tops out at the 72.7th skill percentile, even at full talent leverage. In tennis and movies, the number one sits at the 99th percentile of the skill proxy or above.
- Ranks are too sticky. Model persistence stays near 0.96 everywhere. Real elites run 0.49 to 0.87, and ordered.
The misses extend to concentration. Movie votes are more concentrated (top-20 share 0.883) than the model can reach (at most 0.832). Baseball salaries are less top-heavy at the very top (top-1 share 0.082) than the model's floor (0.217). The nearest cells put tennis and movies at , the model's maximum weight on talent. Even that is not enough.
This reconciles with the one prior calibration by the authors themselves. Zappalà, Biondo, Pluchino and Rapisarda (2023, Chaos, Solitons and Fractals) fit a point-level tennis model. They find a talent weight of only 0.20 to 0.30 per point. But a career aggregates tens of thousands of points, and averaging washes luck out. So points can be luck-dominated while careers end up skill-dominated. That is exactly where our career-level dial lands (). The two estimates are different parameters at different aggregation levels, not a contradiction. Together they say the model is missing an aggregation structure, not a parameter value.
The funding conclusion survives the model, and awaits a real test
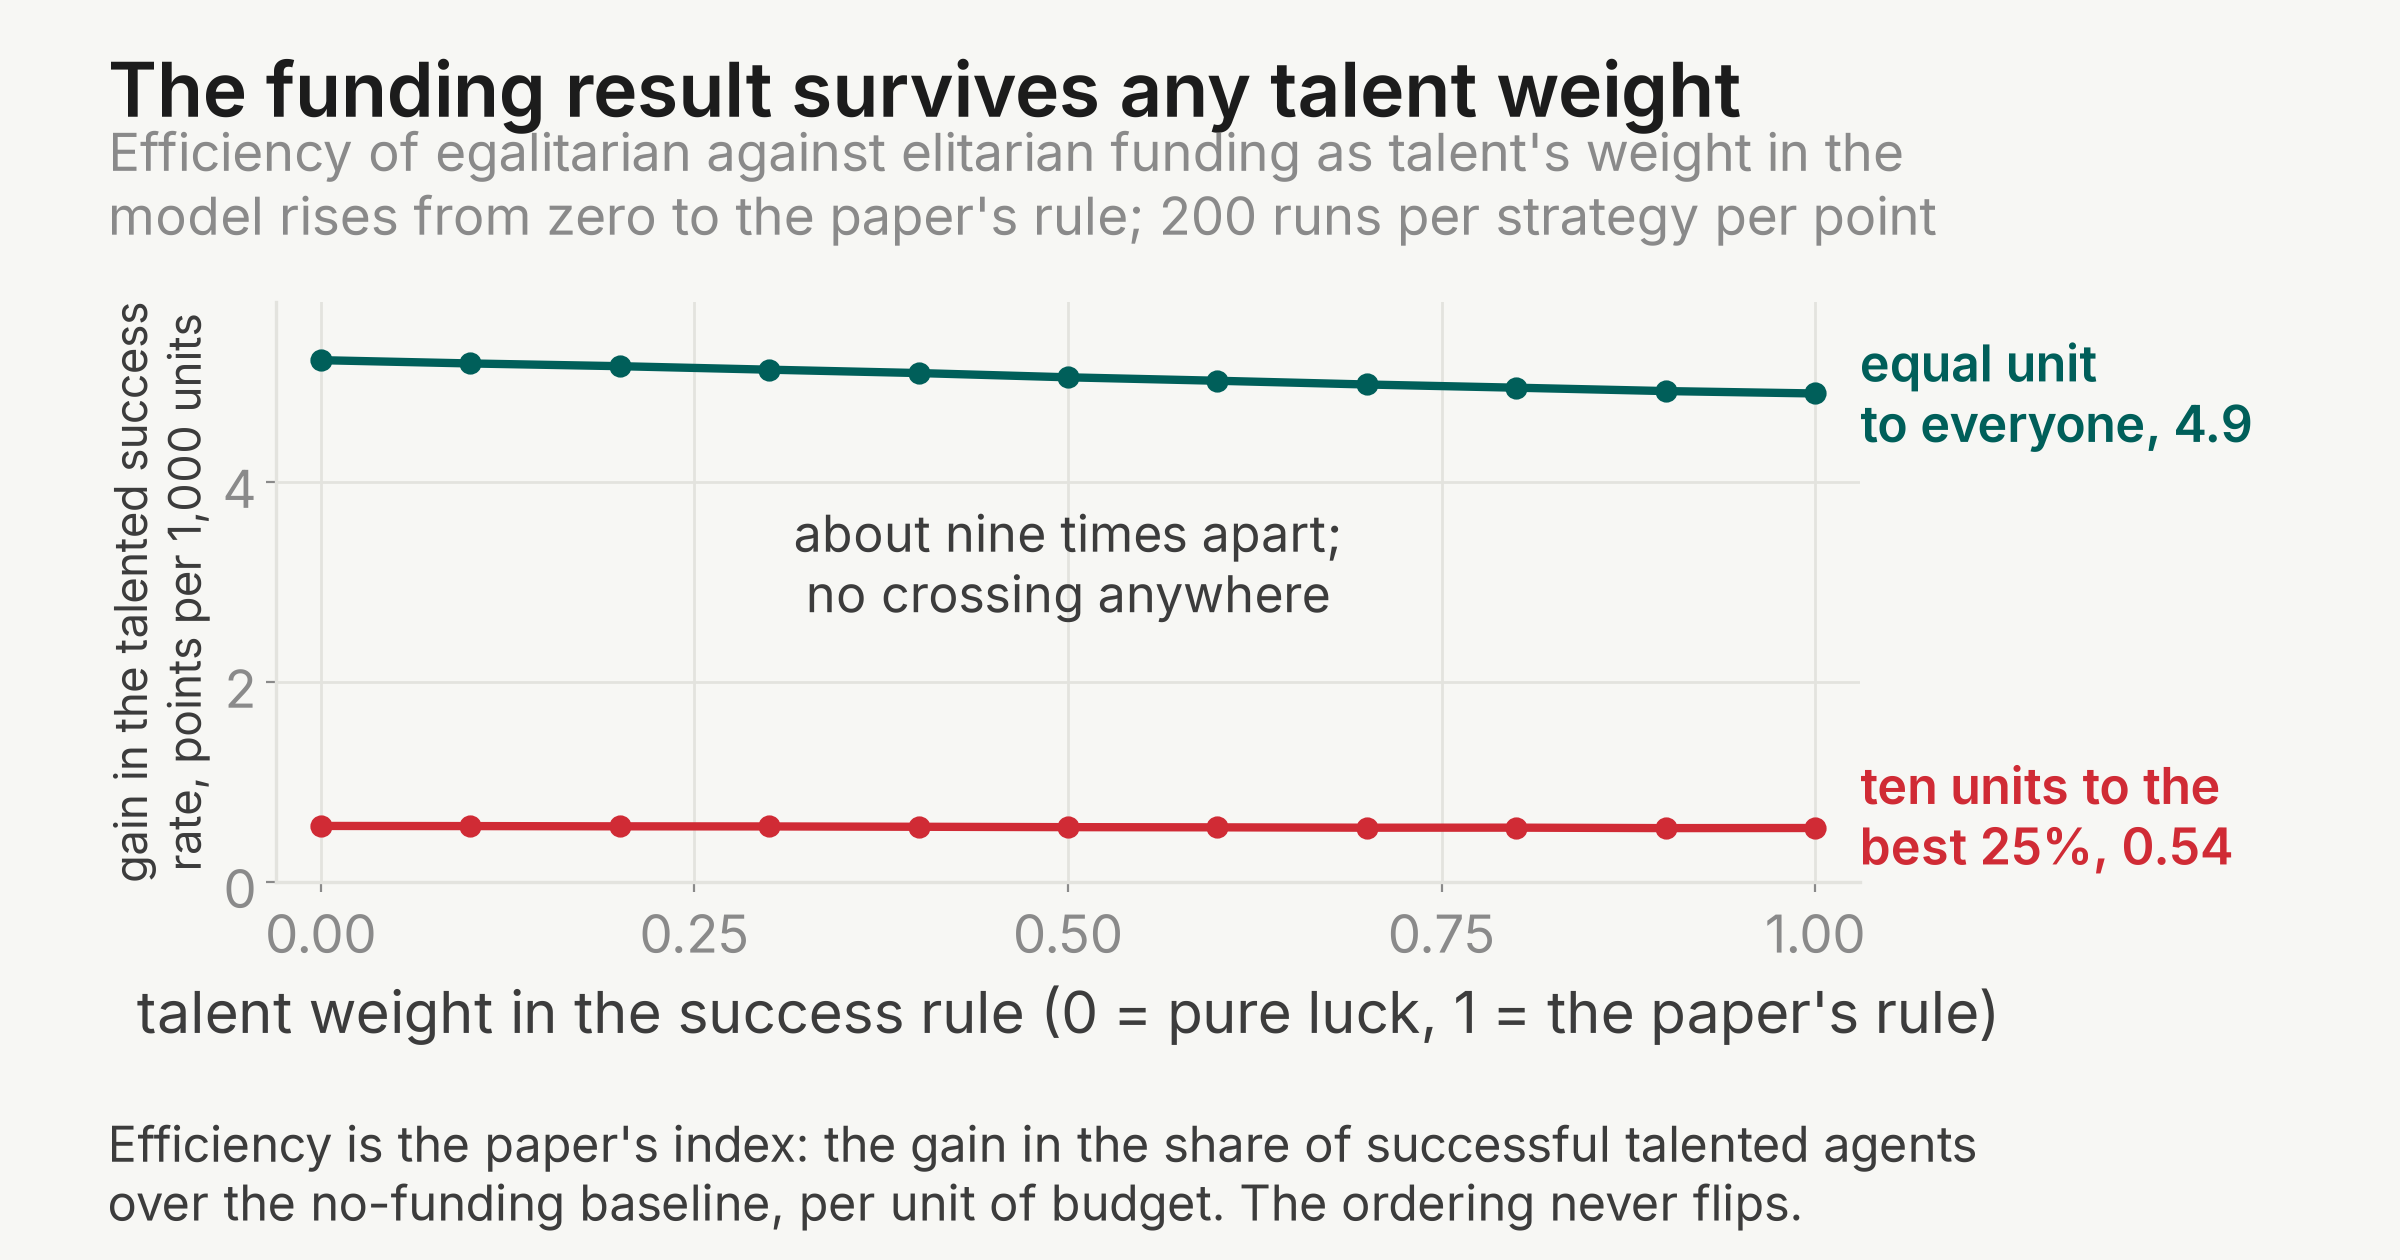
The paper's policy claim fares much better. At every value of the talent dial, one unit to all 1,000 agents beats ten units to the best 250. The efficiency gap is about nine-fold throughout. Per 1,000 units invested, egalitarian funding lifts the share of successful talented agents by 5.2 percentage points at and 4.9 at ; elitarian funding lifts it by 0.56 and 0.54. The ordering never flips. The funding conclusion is not an artifact of the paper's assumption that talent barely matters.
Reality is consistent with this, but has not tested it. Real funding is elitarian and self-reinforcing. Bol, de Vaan and van de Rijt (2018, PNAS) show early-career winners just above a funding threshold accumulate more than twice the funding of near-identical non-winners within eight years. The lotteries the paper argues for now exist, at New Zealand's Health Research Council and the Swiss National Science Foundation. Applicants find them acceptable (Liu et al. 2020, Research Integrity and Peer Review; Heyard et al. 2022). But through 2026, no study compares lottery and panel cohorts on later research outcomes. A future equal-budget comparison in which merit-selected cohorts outperform lottery cohorts would contradict the claim. None exists yet.
The narrow reading is the one the paper's own numbers already hint at. Multiplicative luck really does manufacture extreme inequality from modest talent differences, and the funding ordering is robust within the model. But as a quantitative account of careers, the model fails in the two domains where we could pair success with a skill proxy. There, the most successful rank near the top of the proxy, and real elites churn far more than the model's capital ranks. The warning about reading success as proof of merit stands. The model's specific prediction, that the most successful sit near the 70th percentile of talent, does not fit tennis or movies, though our proxies cannot settle whether the most successful are the most talented.
How this relates to later research
The closest prior work is Janosov, Battiston and Sinatra (2020, EPJ Data Science). It decomposes success in creative and scientific careers into luck and an inferred individual quality, and finds the biggest hit's timing is dominated by luck. Our test differs in two ways. Skill is proxied by a separate measure (points won, hit speed, ratings), not inferred from the success series. And we test the model's quantitative winner-percentile signature, not a decomposition. The two are consistent: luck can govern which project becomes the hit while skill still decides who reaches the top overall.
Denrell and Liu (2012, PNAS) predict a boundary condition our results fit. Extreme performance marks the less able only where outcomes aggregate few, noisy trials. Tennis careers aggregate tens of thousands of points, so their extreme performers are informative about skill. The model's decoupling should be sought in few-trial, high-variance settings. That is where our poker leg sits, and where the public data ran out. Mauboussin's skill-luck continuum (2012, The Success Equation) orders domains the way our persistence ladder does. The one experimental result in this space is Salganik, Dodds and Watts (2006, Science): social influence raised both inequality and unpredictability in artificial music markets. That is qualitative support for decoupling in few-trial reward markets. Our extension does not test that regime; its measured domains are all many-trial.
The authors themselves have a concurrent working paper, Biondo and Pluchino, "When Talent Is Not Enough: Superstar Careers in the Arts" (SSRN 6572147, 2026). We have not yet engaged it in detail and name it here as concurrent work. On the funding side, the lottery literature above is where the model's surviving claim will eventually meet an outcome test.
Notes
These are the judgment calls and data limits behind our numbers, so you can decide how much weight each result deserves.
Show all 11 notes
- The model is a simulation with hand-set parameters, and the paper reports no standard errors. Our model-side bands come from ensembles of at least 100 fresh runs; domain intervals are bootstrap 95 percent intervals.
- The paper's "power law" is weaker than it looks. Capital in the model lives on the lattice , and the printed exponents depend on the fitted range. Fitting from the mode gives where the paper prints ; fitting only the visible tail moves our value toward the paper's. The paper does not state its fitting method. A modern goodness-of-fit test in the style of Clauset, Shalizi and Newman would likely not prefer a pure power law over a lognormal. The fat tail and the 80-20 concentration are robust to all of this; the exponent values are not.
- Several test thresholds were calibrated on preview extracts of the same data sources, not on independent data. This covers the 0.6 concentration cutoff and the 95th-percentile decoupling cut. The tennis concentration verdict is sensitive to its threshold: the measured 0.639 sits just above the 0.6 cutoff. The decoupling results are not sensitive (99.4 and 99.9 against a 95 cut).
- Tennis's skill measure, career share of points won, is independent in grain but not fully ex-ante: titles are won by winning those same points. Excluding all final-match points leaves every result unchanged. That limits the circularity but does not remove it, since earlier rounds also feed titles.
- The movie skill proxy (IMDb rating) is our weakest; ratings and votes could influence each other. Within each decile of votes, the rating-votes correlation has median absolute value 0.023, so the confound looks small at the grain the test uses.
- The baseball skill panel (431 Statcast-era players with All-Star or award success) is too small to decide the decoupling test. Its salary series ends in 2016 at the source. We report baseball as uninformative, not as support.
- Chess enters only the persistence ladder; Elo is both skill and success, so the decoupling test is degenerate there. Poker's public record (champion lists with field sizes) is top-truncated. Its repeat-champion test was declared uninformative in advance, and its luck-end placement rests on the cited literature, not on our measurement.
- The funding efficiency metric inherits a design choice of the paper. counts talented agents ending above their exact starting capital, a line that sits on the capital lattice, and any equal transfer crosses it by construction. Our sweep shows the ordering is robust to the talent dial; it does not test alternative success metrics.
- The model reference runs clip talent to . That truncates about 3 in 100,000 draws at baseline, which is numerically immaterial. The replication of section 3.2 runs unclipped, matching the released demo and the paper's reported values.
- Two canonical upstream repositories, Jeff Sackmann's
tennis_atpand Chadwick Bureau'sbaseballdatabank, returned 404 during our October 2026 collection. Both datasets reached us through documented mirrors (details below). Public sports-data infrastructure this load-bearing is fragile, and pinned snapshots matter. - The MusicLab raw data (the natural few-trial entertainment test) sits behind an archive that refuses keyless access, so that leg is literature-only.
Appendix: the replication in detail
The illustrated single run
The paper opens with one illustrated run. Our re-run of the authors' demo is also one run, at a fixed seed. So the two columns below are two draws of the same stochastic model, not a test of agreement. We checked each printed value against ensembles of 100 to 300 fresh runs of the released rules. Both columns' values sit inside those bands, with two exceptions noted below.
| Quantity (single run) | Paper | Our re-run of the demo |
|---|---|---|
| Agents above 500 units | 4 | 8 |
| Capital held by the 20 most successful, percent | 44 | 56.9 |
| Agents ending below the starting 10 units, percent | about 50 | 40.3 |
| Agents with no events at all, percent | about 16 | 16.4 |
| Agents with only one type of event, percent | about 40 | 48.8 |
| Mean lucky, unlucky events per agent | 1.35, 1.66 | 1.61, 1.41 |
| Maximum lucky, unlucky events | 10, 15 | 12, 11 |
| Most successful agent: capital, talent | 2,560 at 0.61 | 10,240 at 0.878 |
| Poorest agent: capital, talent | 0.00061 at 0.74 | 0.0098 at 0.535 |
| Power-law slope of the run's capital distribution |
Notes. Both columns are single draws; the ensemble, not either column, is the test. Two printed values fall outside the released rules' bands. The "about 40 percent" one-event-type share is below a 200-run band of 45.2 to 52.4 percent (minimum observed 43.3). The slope also depends on the fitted range (see Notes). Our demo re-run used NetLogo 6.4.0 with seed 12345 and added logging only.
The multiple-run results
| Quantity (sections 2.2 and 3.1) | Paper | Ours |
|---|---|---|
| Best-performer talent over 10,000 runs: mean, s.d. | 0.667, 0.09 | 0.670, 0.093 |
| Mean best-performer talent over 100 runs | 0.66 | 0.668 |
| Pooled capital power-law slope, 100 runs | ||
| Talented agents above starting capital with no funding , percent | 32.05 | 31.7 |
| Agents with talent above 0.8 winning a run, percent | 3 | 8.0 |
| Average capital: most talented, above-average talent | 63, 33 | 61.7, 23.9 |
| Highest capital across 100 runs | above 40,000 | 655,360 |
Notes. Our and winner statistics come from the rebuilt engine; the authors released no multiple-run code. The 3-against-8 row is the discrepancy discussed in the body: the printed 3 percent sits below everything the released rules produce (30-batch band 3.7 to 14 percent). The slope row is fit-range-dependent (see Notes). The highest-capital row is an extreme-value draw with a very wide band.
The funding tables
| Quantity (Figure 10 family, 100 runs per strategy) | Paper | Ours |
|---|---|---|
| ALL EQUAL 1u: , , percent | 69.48, 37.43 | 70.65, 38.98 |
| ALL EQUAL 2u: , percent | 84.02 | 86.58 |
| 25% BEST 5u, OTHERS 1u (mixed): , percent | 70.83 | 73.20 |
| 10% RANDOM 5u: , percent | 17.78 | 19.76 |
| At 10,000 units: random , elitarian | 35.95, 9.03 | 39.01, 9.50 |
| Most efficient strategy | ALL EQUAL 1u (1.00) | 10% RANDOM 5u, then ALL EQUAL 1u (0.986) |
| 25% BEST 10u, OTHERS 5u: budget | 70,000 | 50,000 by the row's own rule |
Notes. is the gain over the no-funding baseline; the efficiency index divides it by the budget. Our egalitarian and random rows run 2 to 5 points above the printed values across the table, while elitarian rows land within half a point: the systematic offset discussed in the body. The paper itself calls differences within 2 percent noise, which covers our top-two swap. The last row is the paper's internal arithmetic error: the printed budget does not match the row's own allocation rule.
The environment experiments
| Quantity (section 3.2, 100 runs each) | Paper | Ours |
|---|---|---|
| , talent spread doubled (), percent | 38 | 35.0 |
| , talent mean raised (), percent | 37.5 | 34.0 |
| Most-talented average capital, the two panels | 319, 122 | 71, 173 |
| percent: , percent | 62.18 | 59.1 |
| percent: best capital, most-talented average | 163,840, 149 | 327,680, 180 |
| percent: , percent | 8.75 | 9.7 |
| percent: best capital | 5,120 | 2,560 |
| Best-performer talent, run | 0.97 | 0.654 |
Notes. The rows carry the systematic offset discussed in the body: printed values several batch standard deviations from the rebuilt model's means (about seven for the first two rows), in both directions. The capital rows are extreme-value or heavy-tailed draws whose wide bands cover both columns. The exception is the paper's 319, which sits above the band and which the paper itself calls quite sensitive. These runs use unclipped talent; under the paper's stated truncation, the 319 row's defining set is empty (see body).
Data sources for the extension studies
The extension studies pulled fresh public data on October 22, 2026. In full:
Show all 9 sources
- ATP tennis match and ranking files, 1991–2026 (
atp_matches_1991.csvthroughatp_matches_2025.csvand weekly rankings), created by Jeff Sackmann / Tennis Abstract and licensed CC BY-NC-SA 4.0. The canonical GitHub repositoryJeffSackmann/tennis_atpreturned 404 on the collection date, so files came from the documented archival mirrorAneeshers/tennis-sackmann-archive(a snapshot of the June 2026 upstream commits). Raw files are not redistributed. - FIDE standard rating lists, January 2015 through January 2026 (
standard_jan15frl.ziptostandard_jan26frl.zip), downloaded directly from ratings.fide.com. - Lahman Baseball Database v14.0-0 (February 2026 release; Teams, Batting, All-Star, awards, People and Salaries tables, the salary series ending in 2016 at the source), CC BY-SA 3.0, via the Lahman R package mirror; the canonical GitHub repository
chadwickbureau/baseballdatabankalso returned 404 on the collection date. - MLB Statcast leaderboards from Baseball Savant: average exit velocity and sprint speed, seasons 2015–2026, keyless CSV endpoints, used as derived aggregates only.
- IMDb Non-Commercial Datasets (
title.ratings.tsv.gz,title.basics.tsv.gz, October 22, 2026 snapshot), filtered to 49,346 movies with at least 1,000 votes. Information courtesy of IMDb (https://www.imdb.com). Used with permission. Raw files are not redistributed. - OpenAlex works API (CC0): pinned 5,000-work samples of 2015, 2010 and 2019 articles (seeded queries, logged page by page), for citation concentration.
- English Wikipedia, "List of World Series of Poker Main Event champions" (revision 1368075126) and the bracelet list (revision 1362552102), CC BY-SA 4.0, parsed to
poker_events.csv(57 Main Event years, 1970–2026). - Literature anchors engaged above: Janosov, Battiston and Sinatra (2020); Zappalà, Biondo, Pluchino and Rapisarda (2023); Denrell and Liu (2012); Levitt and Miles (2014); Bol, de Vaan and van de Rijt (2018); Salganik, Dodds and Watts (2006); Liu et al. (2020); Heyard et al. (2022); Mauboussin (2012); Sobkowicz et al. (2020, Physica A), a lower bound on luck in sprinting.
- Pluchino, Biondo and Rapisarda (2018), Advances in Complex Systems 21(3-4), doi:10.1142/S0219525918500145: the released NetLogo demo
TvLmodel.nlogo, re-run and instrumented for the replication; the rebuilt enginereimpl/tvl.pygenerated all model-side references.
The theory-update study (the talent dial and the funding sweep) fetched no new data; it works entirely from the replication engine and the signature study's outputs.
The full working directory for this paper, with the replication and extension code and outputs, is public at github.com/living-sciences/living-talent-vs-luck.
Discussion
Sign in to join the discussion.
Loading discussion…